Hadley Cell Metrics
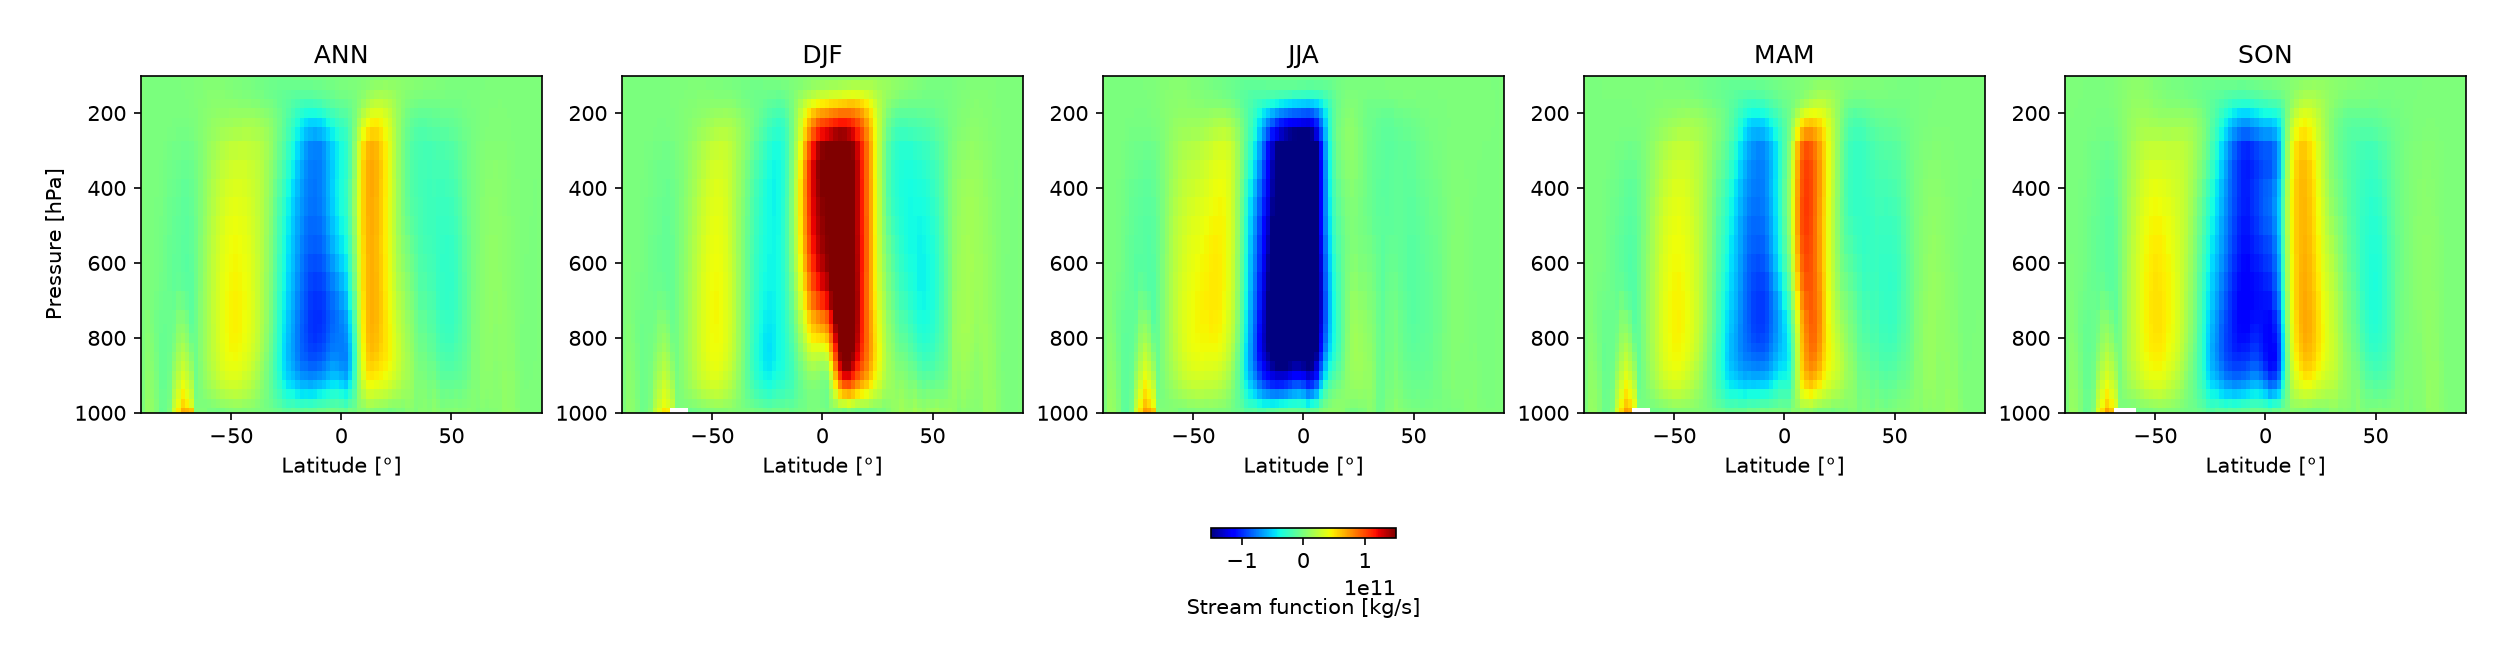
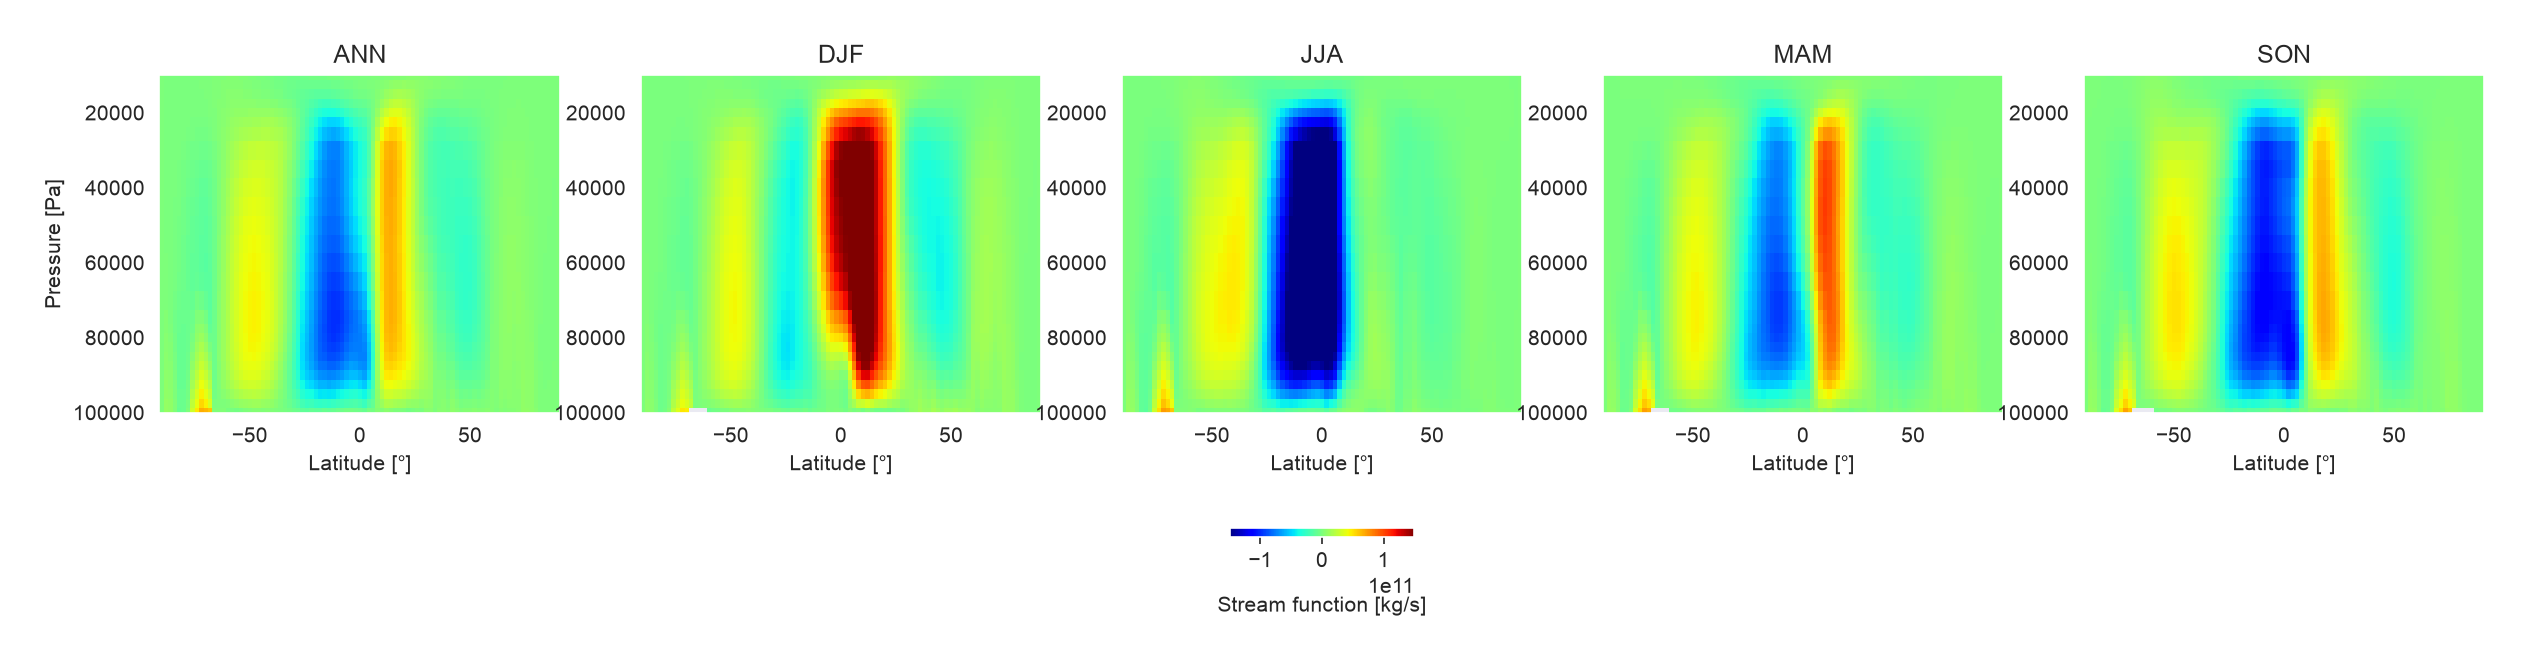
This notebook demonstrates how to use the PMP Hadley Cell API. The API uses meridional wind data and surface pressure data to calculate the meridional stream function (psi) from zonal-mean (averaged over all longitudes) meridional wind. The API can produce monthly psi, annual edge positions, and climatological psi at 500 hPa.
References
Hur, I., Yoo, C., Yeh, S.-W., Kim, Y.-H., & Seo, K.-H. (2024). Processes driving the intermodel spread of the Southern Hemisphere Hadley Circulation expansion in CMIP6 models. Journal of Geophysical Research: Atmospheres, 129, e2024JD041726. https://doi.org/10.1029/2024JD041726
Hur, I., Kim, M., Kwak, K. et al. Hadley Circulation in the Present and Future Climate Simulations of the K-ACE Model. Asia-Pac J Atmos Sci 58, 353-363 (2022). https://doi.org/10.1007/s13143-021-00256-z
[1]:
import requests
from pathlib import Path
from urllib.parse import urlparse, unquote

import xarray as xr
import xcdat as xc
from pcmdi_metrics.hadley_cell import hadley_cell_metrics
Download sample data
[2]:
# sample raw ERA5 data
era5 = [
    "https://pcmdi.llnl.gov/pss/pmpdata/hadley_cell_demo/era5/psl/e5.moda.an.sfc.128_151_msl.ll025sc.2020010100_2020120100.nc",
    "https://pcmdi.llnl.gov/pss/pmpdata/hadley_cell_demo/era5/psl/e5.moda.an.sfc.128_151_msl.ll025sc.2021010100_2021120100.nc",
    "https://pcmdi.llnl.gov/pss/pmpdata/hadley_cell_demo/era5/psl/e5.moda.an.sfc.128_151_msl.ll025sc.2022010100_2022120100.nc",
    "https://pcmdi.llnl.gov/pss/pmpdata/hadley_cell_demo/era5/va-plev37/e5.moda.an.pl.128_132_v.ll025uv.2020010100_2020120100.nc",
    "https://pcmdi.llnl.gov/pss/pmpdata/hadley_cell_demo/era5/va-plev37/e5.moda.an.pl.128_132_v.ll025uv.2021010100_2021120100.nc",
    "https://pcmdi.llnl.gov/pss/pmpdata/hadley_cell_demo/era5/va-plev37/e5.moda.an.pl.128_132_v.ll025uv.2022010100_2022120100.nc",
]

# sample obs4MIPs processed ERA5 data
obs4mips = [
    "https://pcmdi.llnl.gov/pss/pmpdata/hadley_cell_demo/era5/obs4MIPs/psl/psl_mon_ERA-5_PCMDI_gn_202001-202012.nc",
    "https://pcmdi.llnl.gov/pss/pmpdata/hadley_cell_demo/era5/obs4MIPs/psl/psl_mon_ERA-5_PCMDI_gn_202101-202112.nc",
    "https://pcmdi.llnl.gov/pss/pmpdata/hadley_cell_demo/era5/obs4MIPs/psl/psl_mon_ERA-5_PCMDI_gn_202201-202212.nc",
    "https://pcmdi.llnl.gov/pss/pmpdata/hadley_cell_demo/era5/obs4MIPs/va/va_mon_ERA-5_PCMDI_gn_202001-202012.nc",
    "https://pcmdi.llnl.gov/pss/pmpdata/hadley_cell_demo/era5/obs4MIPs/va/va_mon_ERA-5_PCMDI_gn_202101-202112.nc",
    "https://pcmdi.llnl.gov/pss/pmpdata/hadley_cell_demo/era5/obs4MIPs/va/va_mon_ERA-5_PCMDI_gn_202201-202212.nc",
]

# sample model data (E3SM-2-1)
e3sm=[
    "https://pcmdi.llnl.gov/pss/pmpdata/hadley_cell_demo/e3sm-2-1/psl/psl_Amon_E3SM-2-1_historical_r1i1p1f1_gr_200001-201412.nc",
    "https://pcmdi.llnl.gov/pss/pmpdata/hadley_cell_demo/e3sm-2-1/va/va_Amon_E3SM-2-1_historical_r1i1p1f1_gr_200001-201412.nc",
]

datasets = ["era5", "obs4mips", "e3sm"]
urls = [era5, obs4mips, e3sm]
[3]:
for ds in range(0, len(datasets)):
    output_dir = Path(f"./demo_data/hadley_cell_demo/{datasets[ds]}")
    output_dir.mkdir(parents=True, exist_ok=True)

    for url in urls[ds]:

        parsed_url = urlparse(url)
        filename = Path(unquote(parsed_url.path)).name

        if not filename:
            filename = "downloaded_file"

        output_path = output_dir / filename

        response = requests.get(url, stream=True, timeout=30)
        response.raise_for_status()

        with output_path.open("wb") as file:
            for chunk in response.iter_content(chunk_size=8192):
                if chunk:
                    file.write(chunk)

        print(f"Saved: {output_path}")
Saved: demo_data/hadley_cell_demo/era5/e5.moda.an.sfc.128_151_msl.ll025sc.2020010100_2020120100.nc
Saved: demo_data/hadley_cell_demo/era5/e5.moda.an.sfc.128_151_msl.ll025sc.2021010100_2021120100.nc
Saved: demo_data/hadley_cell_demo/era5/e5.moda.an.sfc.128_151_msl.ll025sc.2022010100_2022120100.nc
Saved: demo_data/hadley_cell_demo/era5/e5.moda.an.pl.128_132_v.ll025uv.2020010100_2020120100.nc
Saved: demo_data/hadley_cell_demo/era5/e5.moda.an.pl.128_132_v.ll025uv.2021010100_2021120100.nc
Saved: demo_data/hadley_cell_demo/era5/e5.moda.an.pl.128_132_v.ll025uv.2022010100_2022120100.nc
Saved: demo_data/hadley_cell_demo/obs4mips/psl_mon_ERA-5_PCMDI_gn_202001-202012.nc
Saved: demo_data/hadley_cell_demo/obs4mips/psl_mon_ERA-5_PCMDI_gn_202101-202112.nc
Saved: demo_data/hadley_cell_demo/obs4mips/psl_mon_ERA-5_PCMDI_gn_202201-202212.nc
Saved: demo_data/hadley_cell_demo/obs4mips/va_mon_ERA-5_PCMDI_gn_202001-202012.nc
Saved: demo_data/hadley_cell_demo/obs4mips/va_mon_ERA-5_PCMDI_gn_202101-202112.nc
Saved: demo_data/hadley_cell_demo/obs4mips/va_mon_ERA-5_PCMDI_gn_202201-202212.nc
Saved: demo_data/hadley_cell_demo/e3sm/psl_Amon_E3SM-2-1_historical_r1i1p1f1_gr_200001-201412.nc
Saved: demo_data/hadley_cell_demo/e3sm/va_Amon_E3SM-2-1_historical_r1i1p1f1_gr_200001-201412.nc
Example 1: Raw ERA-5 Data
Pre-process sample data:
[4]:
model_name = 'ERA5-raw-data'
data_path = "./demo_data/hadley_cell_demo/era5/"
data_output_path = "demo_output/hadley_cell_ERA5-raw"
[10]:
vwnd_files = sorted(Path(data_path).glob("*_v.*"))
psl_files = sorted(Path(data_path).glob("*_msl.*"))

if not vwnd_files:
    raise FileNotFoundError(f"No va files found in {data_path}")
if not psl_files:
    raise FileNotFoundError(f"No pl files found in {data_path}")

vwnd_datasets = xr.open_mfdataset(vwnd_files, combine="by_coords")
ps_datasets = xr.open_mfdataset(psl_files, combine="by_coords")
NOTE: add a regridding step for high resolution datasets to reduce computation time
[11]:
target_grid = xc.regridder.grid.create_uniform_grid(-90, 90, 2, -180, 180, 2)
vwnd_regridded = vwnd_datasets.regridder.horizontal('V', target_grid, tool='xesmf', method='bilinear')
ps_regridded = ps_datasets.regridder.horizontal('MSL', target_grid, tool='xesmf', method='bilinear')
[12]:
hadley_cell_metrics(
    vwnd_ds = vwnd_regridded,
    ps_ds = ps_regridded,
    vwnd_var = 'V',
    ps_var = 'MSL',
    output_dir = data_output_path,
    model_name = model_name,
    lev_dim = 'level'
)
Saved: demo_output/hadley_cell_ERA5-raw/ERA5-raw-data_monthly_psi.nc
Saved: demo_output/hadley_cell_ERA5-raw/ERA5-raw-data_annual_edges.nc
Saved: demo_output/hadley_cell_ERA5-raw/ERA5-raw-data_seasonal_psi.png
Saved: demo_output/hadley_cell_ERA5-raw/ERA5-raw-data_clim_psi500.nc
[12]:
{'monthly_psi': 'demo_output/hadley_cell_ERA5-raw/ERA5-raw-data_monthly_psi.nc',
 'annual_edges': 'demo_output/hadley_cell_ERA5-raw/ERA5-raw-data_annual_edges.nc',
 'clim_psi500': 'demo_output/hadley_cell_ERA5-raw/ERA5-raw-data_clim_psi500.nc',
 'clim_plot': 'demo_output/hadley_cell_ERA5-raw/ERA5-raw-data_seasonal_psi.png'}
Display the seasonal psi image file:
[13]:
import matplotlib.pyplot as plt
import matplotlib.image as mpimg

# Read the PNG image
img = mpimg.imread(f'{data_output_path}/{model_name}_seasonal_psi.png')

# Display high quality image without layout padding
height, width, _ = img.shape
fig = plt.figure(figsize=(width/300, height/300), dpi=300)

ax = plt.Axes(fig, [0., 0., 1., 1.])
ax.set_axis_off()
fig.add_axes(ax)

ax.imshow(img)
plt.show()
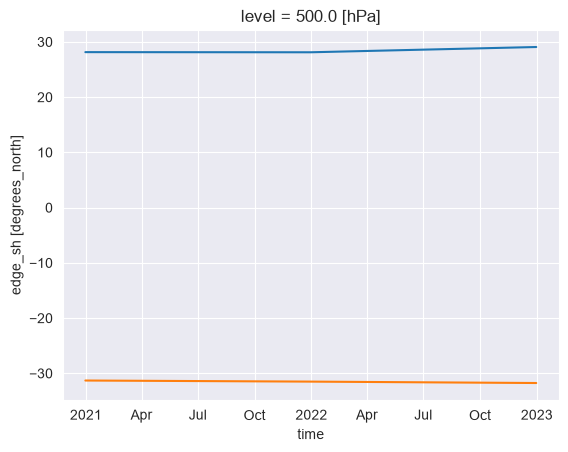
Plot the northern hemisphere and southern hemisphere edge positions over time:
[14]:
edges = xr.open_dataset(f'{data_output_path}/{model_name}_annual_edges.nc')
[15]:
import seaborn as sns

sns.set_style(style="darkgrid")
edges.edge_nh.plot(x='time')
edges.edge_sh.plot(x='time')
[15]:
[<matplotlib.lines.Line2D at 0x32ecdf8c0>]
Example 2: Obs4MIPs data
[17]:
model_name = 'ERA5-Obs4MIPs-data'
data_path = "./demo_data/hadley_cell_demo/obs4mips/"
data_output_path = "demo_output/hadley_cell_ERA5-obs4MIPs"
[18]:
vwnd_files = sorted(Path(data_path).glob("va*"))
psl_files = sorted(Path(data_path).glob("psl*"))

if not vwnd_files:
        raise FileNotFoundError(f"No .nc files found in {data_path}")
if not psl_files:
    raise FileNotFoundError(f"No .nc files found in {data_path}")

vwnd_datasets = xr.open_mfdataset(vwnd_files, combine="by_coords")
ps_datasets = xr.open_mfdataset(psl_files, combine="by_coords")
/var/folders/v0/gtlqk7_x5478x6n8tz5x8qmr001zjz/T/ipykernel_33607/240345049.py:9: FutureWarning: In a future version of xarray the default value for data_vars will change from data_vars='all' to data_vars=None. This is likely to lead to different results when multiple datasets have matching variables with overlapping values. To opt in to new defaults and get rid of these warnings now use `set_options(use_new_combine_kwarg_defaults=True) or set data_vars explicitly.
  vwnd_datasets = xr.open_mfdataset(vwnd_files, combine="by_coords")
/var/folders/v0/gtlqk7_x5478x6n8tz5x8qmr001zjz/T/ipykernel_33607/240345049.py:10: FutureWarning: In a future version of xarray the default value for data_vars will change from data_vars='all' to data_vars=None. This is likely to lead to different results when multiple datasets have matching variables with overlapping values. To opt in to new defaults and get rid of these warnings now use `set_options(use_new_combine_kwarg_defaults=True) or set data_vars explicitly.
  ps_datasets = xr.open_mfdataset(psl_files, combine="by_coords")
[19]:
target_grid = xc.regridder.grid.create_uniform_grid(-90, 90, 2, -180, 180, 2)
vwnd_regridded = vwnd_datasets.regridder.horizontal('va', target_grid, tool='xesmf', method='bilinear')
ps_regridded = ps_datasets.regridder.horizontal('psl', target_grid, tool='xesmf', method='bilinear')
[20]:
hadley_cell_metrics(
    vwnd_ds = vwnd_regridded,
    ps_ds = ps_regridded,
    vwnd_var = 'va',
    ps_var = 'psl',
    output_dir = data_output_path,
    model_name = model_name,
    lev_dim = 'plev'
)
Saved: demo_output/hadley_cell_ERA5-obs4MIPs/ERA5-Obs4MIPs-data_monthly_psi.nc
Saved: demo_output/hadley_cell_ERA5-obs4MIPs/ERA5-Obs4MIPs-data_annual_edges.nc
Saved: demo_output/hadley_cell_ERA5-obs4MIPs/ERA5-Obs4MIPs-data_seasonal_psi.png
Saved: demo_output/hadley_cell_ERA5-obs4MIPs/ERA5-Obs4MIPs-data_clim_psi500.nc
[20]:
{'monthly_psi': 'demo_output/hadley_cell_ERA5-obs4MIPs/ERA5-Obs4MIPs-data_monthly_psi.nc',
 'annual_edges': 'demo_output/hadley_cell_ERA5-obs4MIPs/ERA5-Obs4MIPs-data_annual_edges.nc',
 'clim_psi500': 'demo_output/hadley_cell_ERA5-obs4MIPs/ERA5-Obs4MIPs-data_clim_psi500.nc',
 'clim_plot': 'demo_output/hadley_cell_ERA5-obs4MIPs/ERA5-Obs4MIPs-data_seasonal_psi.png'}
[21]:
# Read the PNG image
img = mpimg.imread(f'{data_output_path}/{model_name}_seasonal_psi.png')

# Display high quality image without layout padding
height, width, _ = img.shape
fig = plt.figure(figsize=(width/300, height/300), dpi=300)

ax = plt.Axes(fig, [0., 0., 1., 1.])
ax.set_axis_off()
fig.add_axes(ax)

ax.imshow(img)
plt.show()
[22]:
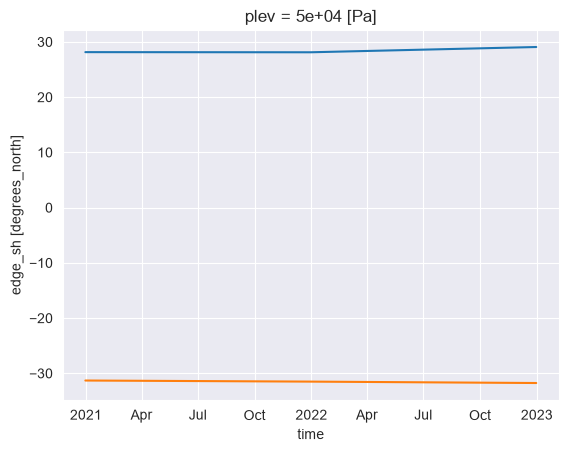
edges = xr.open_dataset(f'{data_output_path}/{model_name}_annual_edges.nc')

sns.set_style(style="darkgrid")
edges.edge_nh.plot(x='time')
edges.edge_sh.plot(x='time')
[22]:
[<matplotlib.lines.Line2D at 0x32ed9ecf0>]
Example 3: E3SM-2-1 data
[23]:
model_name = "E3SM-2-1"
data_path = "./demo_data/hadley_cell_demo/e3sm"
data_output_path = "demo_output/hadley_cell_E3SM-2-1"
[26]:
vwnd_files = sorted(Path(data_path).glob("va*"))
psl_files = sorted(Path(data_path).glob("psl*"))

if not vwnd_files:
        raise FileNotFoundError(f"No .nc files found in {data_path}")
if not psl_files:
    raise FileNotFoundError(f"No .nc files found in {data_path}")

vwnd_datasets = xr.open_mfdataset(vwnd_files, combine="by_coords")
ps_datasets = xr.open_mfdataset(psl_files, combine="by_coords")
[27]:
target_grid = xc.regridder.grid.create_uniform_grid(-90, 90, 2, -180, 180, 2)
vwnd_regridded = vwnd_datasets.regridder.horizontal('va', target_grid, tool='xesmf', method='bilinear')
ps_regridded = ps_datasets.regridder.horizontal('psl', target_grid, tool='xesmf', method='bilinear')
[28]:
hadley_cell_metrics(
    vwnd_ds = vwnd_regridded,
    ps_ds = ps_regridded,
    vwnd_var = 'va',
    ps_var = 'psl',
    output_dir = data_output_path,
    model_name = model_name,
    lev_dim = 'plev'
)
Saved: demo_output/hadley_cell_E3SM-2-1/E3SM-2-1_monthly_psi.nc
Saved: demo_output/hadley_cell_E3SM-2-1/E3SM-2-1_annual_edges.nc
Saved: demo_output/hadley_cell_E3SM-2-1/E3SM-2-1_seasonal_psi.png
Saved: demo_output/hadley_cell_E3SM-2-1/E3SM-2-1_clim_psi500.nc
[28]:
{'monthly_psi': 'demo_output/hadley_cell_E3SM-2-1/E3SM-2-1_monthly_psi.nc',
 'annual_edges': 'demo_output/hadley_cell_E3SM-2-1/E3SM-2-1_annual_edges.nc',
 'clim_psi500': 'demo_output/hadley_cell_E3SM-2-1/E3SM-2-1_clim_psi500.nc',
 'clim_plot': 'demo_output/hadley_cell_E3SM-2-1/E3SM-2-1_seasonal_psi.png'}
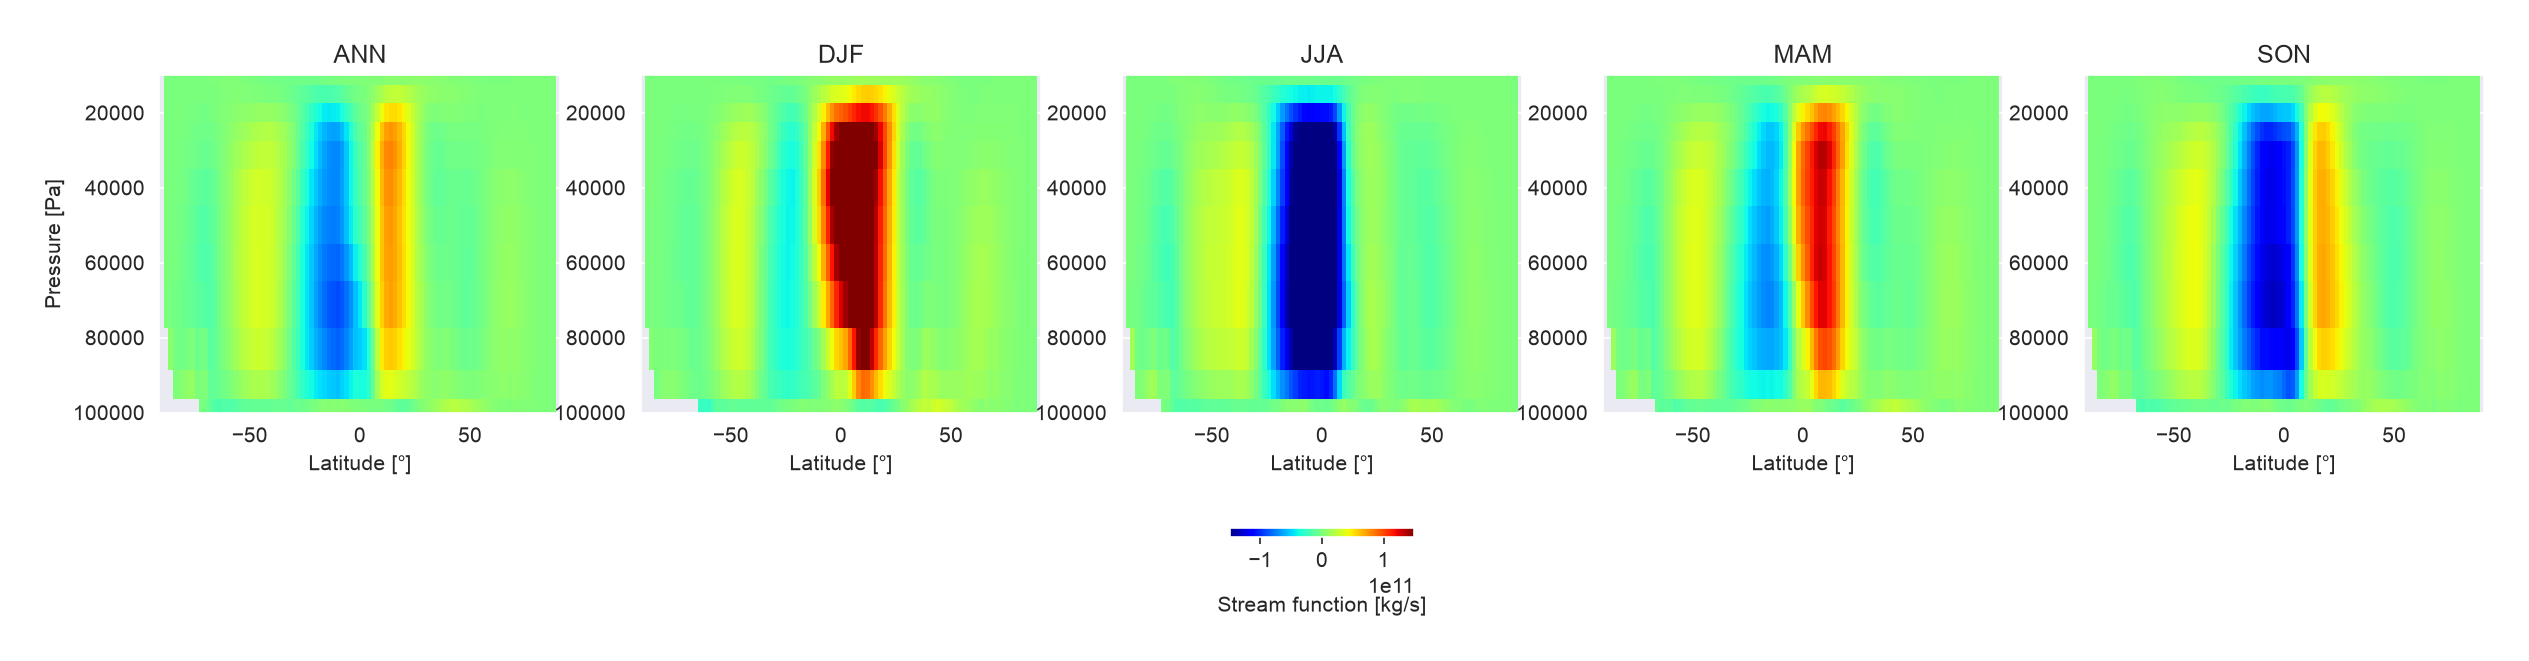
[29]:
# Read the PNG image
img = mpimg.imread(f'{data_output_path}/{model_name}_seasonal_psi.png')

# Display high quality image without layout padding
height, width, _ = img.shape
fig = plt.figure(figsize=(width/300, height/300), dpi=300)

ax = plt.Axes(fig, [0., 0., 1., 1.])
ax.set_axis_off()
fig.add_axes(ax)

ax.imshow(img)
plt.show()
[30]:
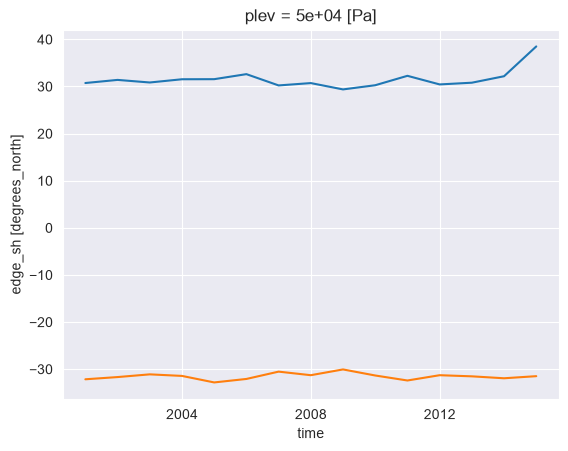
edges = xr.open_dataset(f'{data_output_path}/{model_name}_annual_edges.nc')

sns.set_style(style="darkgrid")
edges.edge_nh.plot(x='time')
edges.edge_sh.plot(x='time')
[30]:
[<matplotlib.lines.Line2D at 0x32f5c1be0>]