pcmdi_metrics.graphics.portrait_plot
- pcmdi_metrics.graphics.portrait_plot(data, xaxis_labels, yaxis_labels, fig=None, ax=None, annotate=False, annotate_data=None, annotate_textcolors=('black', 'white'), annotate_textcolors_threshold=(-2, 2), annotate_fontsize=15, annotate_format='{x:.2f}', figsize=(12, 10), vrange=None, xaxis_fontsize=15, yaxis_fontsize=15, xaxis_tick_labels_top_and_bottom=False, xticklabel_rotation=45, inner_line_color='k', inner_line_width=0.5, cmap='RdBu_r', cmap_bounds=None, cbar_label=None, cbar_label_fontsize=15, cbar_tick_fontsize=12, cbar_kw={}, colorbar_off=False, missing_color='grey', invert_yaxis=True, box_as_square=False, legend_on=False, legend_labels=None, legend_box_xy=None, legend_box_size=None, legend_lw=1, legend_fontsize=14, logo_rect=None, logo_off=False, debug=False)[source]
Create a portrait plot for visualizing 2D data arrays.

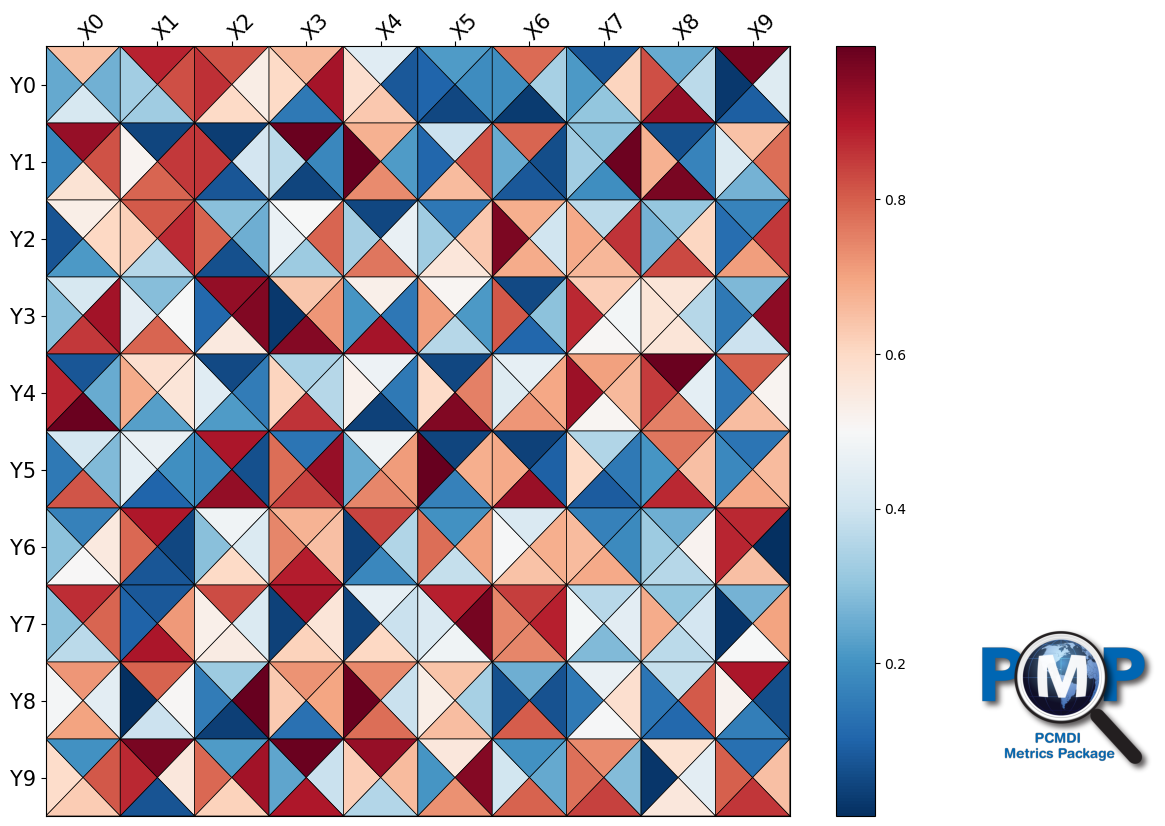
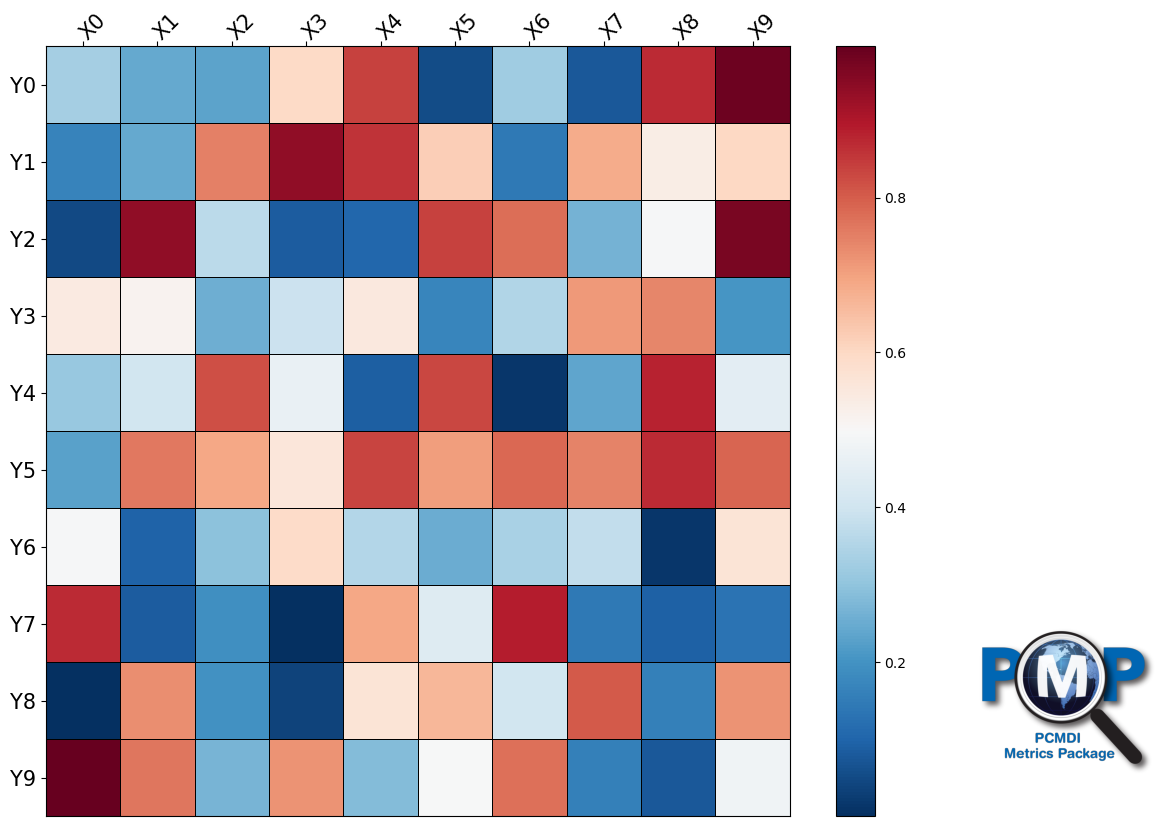
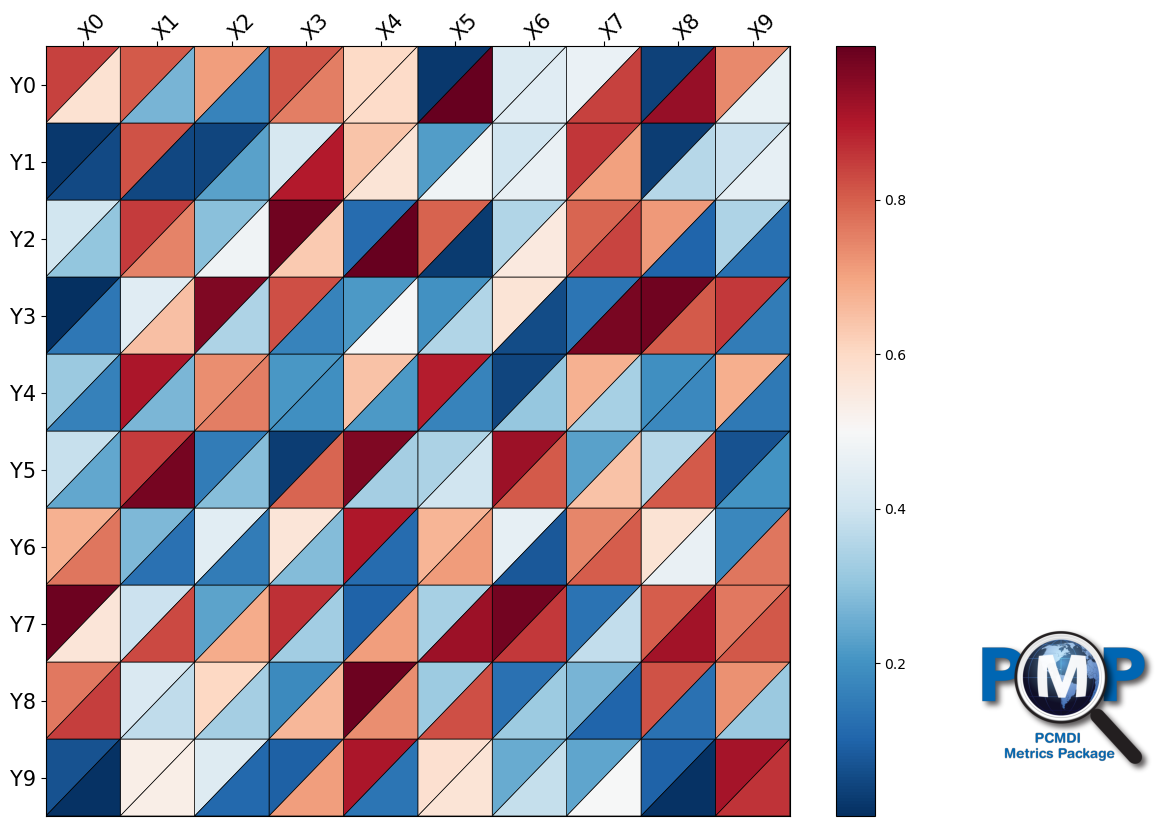
This function generates a versatile portrait plot that can display data as a heatmap, two-triangle, or four-triangle plot. It supports various customization options for annotations, axes, colorbar, legend, and more.
- Parameters:
data (
np.ndarrayorList[np.ndarray]) – 2D numpy array, list of 2D numpy arrays, or 3D numpy array (stacked 2D arrays).xaxis_labels (
List[str]) – Labels for x-axis. Must match the x-axis dimension of data, or be empty to turn off labels.yaxis_labels (
List[str]) – Labels for y-axis. Must match the y-axis dimension of data, or be empty to turn off labels.fig (
Optional[Figure]) – Figure instance to plot on. If None, creates a new figure.ax (
Optional[Axes]) – Axes instance to plot on. If None, uses current axes or creates new ones.annotate (
bool) – If True, adds text annotations to the heatmap (only for non-triangle plots).annotate_data (
Optional[np.ndarray]) – Data to use for annotations. If None, uses the plot data.annotate_textcolors (
Tuple[str,str]) – Colors for annotation text.annotate_textcolors_threshold (
Union[Tuple[float,float],float]) – Threshold values for applying annotation text colors.annotate_fontsize (
int) – Font size for annotations.annotate_format (
str) – Format string for annotation values.figsize (
Tuple[int,int]) – Figure size in inches (width, height).vrange (
Optional[Tuple[float,float]]) – Range of values for colorbar. If None, uses data min and max.xaxis_fontsize (
int) – Font size for x-axis tick labels.yaxis_fontsize (
int) – Font size for y-axis tick labels.xaxis_tick_labels_top_and_bottom (
bool) – If True, displays x-axis tick labels on both top and bottom.xticklabel_rotation (
Union[int,float]) – Rotation angle for x-axis tick labels.inner_line_color (
str) – Color for inner lines in triangle plots.inner_line_width (
float) – Line width for inner lines in triangle plots.cmap (
str) – Colormap name.cmap_bounds (
Optional[List[float]]) – Boundaries for discrete colors. If provided, applies discrete colormap.cbar_label (
Optional[str]) – Label for colorbar.cbar_label_fontsize (
int) – Font size for colorbar label.cbar_tick_fontsize (
int) – Font size for colorbar tick labels.cbar_kw (
Dict[str,Any]) – Additional keyword arguments for colorbar.colorbar_off (
bool) – If True, turns off the colorbar.missing_color (
str) – Color for missing data.invert_yaxis (
bool) – If True, inverts the y-axis (0 at top).box_as_square (
bool) – If True, makes each box square-shaped.legend_on (
bool) – If True, displays a legend (for 2 or 4 triangle plots).legend_labels (
Optional[List[str]]) – Labels for legend items.legend_box_xy (
Optional[Tuple[float,float]]) – Position of legend box’s upper-left corner in axes coordinates.legend_box_size (
Optional[float]) – Size of legend box.legend_lw (
float) – Line width for legend.legend_fontsize (
int) – Font size for legend text.logo_rect (
Optional[List[float]]) – Dimensions [left, bottom, width, height] of PMP logo in figure fraction.logo_off (
bool) – If True, turns off the PMP logo.debug (
bool) – If True, prints additional debugging information.
- Returns:
Union[Tuple[Figure,Axes,Colorbar],Tuple[Figure,Axes]]– The figure, axes, and colorbar components (if colorbar is not turned off).
Notes
The function supports different plot types based on the input data shape: 1D array: heatmap, 2D array: two-triangle plot, 3D array: four-triangle plot.
Various customization options allow for flexible and detailed plot configurations.
Author: Jiwoo Lee @ LLNL (2021. 7)
Last update: 2024. 11.
Examples
Example 1: Create a heatmap-style portrait plot
>>> from pcmdi_metrics.graphics import portrait_plot
>>> import numpy as np
>>> data = np.random.rand(10, 10)
>>> xaxis_labels = [f'X{i}' for i in range(10)]
>>> yaxis_labels = [f'Y{i}' for i in range(10)]
>>> fig, ax, cbar = portrait_plot(data, xaxis_labels, yaxis_labels, cmap='RdBu_r')

Example 2: Create a portrait plot with two triangles
>>> data1 = np.random.rand(10, 10)
>>> data2 = np.random.rand(10, 10)
>>> data = [data1, data2]
>>> fig, ax, cbar = portrait_plot(data, xaxis_labels, yaxis_labels, cmap='RdBu_r')

Example 3: Create a portrait plot with four triangles
>>> data1 = np.random.rand(10, 10)
>>> data2 = np.random.rand(10, 10)
>>> data3 = np.random.rand(10, 10)
>>> data4 = np.random.rand(10, 10)
>>> data = [data1, data2, data3, data4]
>>> fig, ax, cbar = portrait_plot(data, xaxis_labels, yaxis_labels, cmap='RdBu_r')

Further examples can be found here.