Portrait Plot: Mean Climate
Generate a static image of Portrait plot (with or without triangles) using PMP .
Author: Jiwoo Lee (2021.07)
Last update: 2022.10
1. Read data from JSON files
Input data for portrait plot is expected as a set a (stacked or list of) 2-d numpy array(s) with list of strings for x and y axes labels.
1.1 Provide PMP output JSON files
[1]:
import glob
import os
import numpy as np

import requests
PMP output files downloadable from the PMP results archive.
[2]:
vars = ['pr', 'prw', 'psl', 'rlds', 'rltcre', 'rlus', 'rlut', 'rlutcs', 'rsds', 'rsdscs', 'rsdt', 'rstcre', 'rsut', 'rsutcs', 'sfcWind',
        'ta-200', 'ta-850', 'tas', 'tauu', 'ts', 'ua-200', 'ua-850', 'va-200', 'va-850', 'zg-500']

mip = "cmip6"
exp = "historical"
data_version = "v20210811"
json_dir = './json_files'

os.makedirs(json_dir, exist_ok=True)

for var in vars:
    url = "https://raw.githubusercontent.com/PCMDI/pcmdi_metrics_results_archive/main/" + \
          "metrics_results/mean_climate/"+mip+"/"+exp+"/"+data_version+"/"+var+"."+mip+"."+exp+".regrid2.2p5x2p5."+data_version+".json"
    r = requests.get(url, allow_redirects=True)
    filename = os.path.join(json_dir, url.split('/')[-1])
    with open(filename, 'wb') as file:
        file.write(r.content)
    print('Download completed:', filename)
Download completed: ./json_files/pr.cmip6.historical.regrid2.2p5x2p5.v20210811.json
Download completed: ./json_files/prw.cmip6.historical.regrid2.2p5x2p5.v20210811.json
Download completed: ./json_files/psl.cmip6.historical.regrid2.2p5x2p5.v20210811.json
Download completed: ./json_files/rlds.cmip6.historical.regrid2.2p5x2p5.v20210811.json
Download completed: ./json_files/rltcre.cmip6.historical.regrid2.2p5x2p5.v20210811.json
Download completed: ./json_files/rlus.cmip6.historical.regrid2.2p5x2p5.v20210811.json
Download completed: ./json_files/rlut.cmip6.historical.regrid2.2p5x2p5.v20210811.json
Download completed: ./json_files/rlutcs.cmip6.historical.regrid2.2p5x2p5.v20210811.json
Download completed: ./json_files/rsds.cmip6.historical.regrid2.2p5x2p5.v20210811.json
Download completed: ./json_files/rsdscs.cmip6.historical.regrid2.2p5x2p5.v20210811.json
Download completed: ./json_files/rsdt.cmip6.historical.regrid2.2p5x2p5.v20210811.json
Download completed: ./json_files/rstcre.cmip6.historical.regrid2.2p5x2p5.v20210811.json
Download completed: ./json_files/rsut.cmip6.historical.regrid2.2p5x2p5.v20210811.json
Download completed: ./json_files/rsutcs.cmip6.historical.regrid2.2p5x2p5.v20210811.json
Download completed: ./json_files/sfcWind.cmip6.historical.regrid2.2p5x2p5.v20210811.json
Download completed: ./json_files/ta-200.cmip6.historical.regrid2.2p5x2p5.v20210811.json
Download completed: ./json_files/ta-850.cmip6.historical.regrid2.2p5x2p5.v20210811.json
Download completed: ./json_files/tas.cmip6.historical.regrid2.2p5x2p5.v20210811.json
Download completed: ./json_files/tauu.cmip6.historical.regrid2.2p5x2p5.v20210811.json
Download completed: ./json_files/ts.cmip6.historical.regrid2.2p5x2p5.v20210811.json
Download completed: ./json_files/ua-200.cmip6.historical.regrid2.2p5x2p5.v20210811.json
Download completed: ./json_files/ua-850.cmip6.historical.regrid2.2p5x2p5.v20210811.json
Download completed: ./json_files/va-200.cmip6.historical.regrid2.2p5x2p5.v20210811.json
Download completed: ./json_files/va-850.cmip6.historical.regrid2.2p5x2p5.v20210811.json
Download completed: ./json_files/zg-500.cmip6.historical.regrid2.2p5x2p5.v20210811.json
Check JSON files
[3]:
json_list = sorted(glob.glob(os.path.join(json_dir, '*' + mip + '*' + data_version + '.json')))
for json_file in json_list:
    print(json_file.split('/')[-1])
pr.cmip6.historical.regrid2.2p5x2p5.v20210811.json
prw.cmip6.historical.regrid2.2p5x2p5.v20210811.json
psl.cmip6.historical.regrid2.2p5x2p5.v20210811.json
rlds.cmip6.historical.regrid2.2p5x2p5.v20210811.json
rltcre.cmip6.historical.regrid2.2p5x2p5.v20210811.json
rlus.cmip6.historical.regrid2.2p5x2p5.v20210811.json
rlut.cmip6.historical.regrid2.2p5x2p5.v20210811.json
rlutcs.cmip6.historical.regrid2.2p5x2p5.v20210811.json
rsds.cmip6.historical.regrid2.2p5x2p5.v20210811.json
rsdscs.cmip6.historical.regrid2.2p5x2p5.v20210811.json
rsdt.cmip6.historical.regrid2.2p5x2p5.v20210811.json
rstcre.cmip6.historical.regrid2.2p5x2p5.v20210811.json
rsut.cmip6.historical.regrid2.2p5x2p5.v20210811.json
rsutcs.cmip6.historical.regrid2.2p5x2p5.v20210811.json
sfcWind.cmip6.historical.regrid2.2p5x2p5.v20210811.json
ta-200.cmip6.historical.regrid2.2p5x2p5.v20210811.json
ta-850.cmip6.historical.regrid2.2p5x2p5.v20210811.json
tas.cmip6.historical.regrid2.2p5x2p5.v20210811.json
tauu.cmip6.historical.regrid2.2p5x2p5.v20210811.json
ts.cmip6.historical.regrid2.2p5x2p5.v20210811.json
ua-200.cmip6.historical.regrid2.2p5x2p5.v20210811.json
ua-850.cmip6.historical.regrid2.2p5x2p5.v20210811.json
va-200.cmip6.historical.regrid2.2p5x2p5.v20210811.json
va-850.cmip6.historical.regrid2.2p5x2p5.v20210811.json
zg-500.cmip6.historical.regrid2.2p5x2p5.v20210811.json
1.2 Extract data from JSON files
Use Metrics class (that use read_mean_clim_json_files function underneath) to extract data from the above JSON files.
Parameters
json_list: list of string, where each element is for path/file for PMP output JSON files
Returned object includes
df_dict: dictionary that has[stat][season][region]hierarchy structure storing pandas dataframe for metric numbers (Rows: models, Columns: variables (i.e., 2d array)var_list: list of string, all variables from JSON filesvar_unit_list: list of string, all variables and its units from JSON filesvar_ref_dict: dictonary for reference dataset used for each variableregions: list of string, regionsstats: list of string, statistics
[4]:
from pcmdi_metrics.graphics import Metrics
[5]:
library = Metrics(json_list)

df_dict = library.df_dict
var_list = library.var_list
var_unit_list = library.var_unit_list
regions = library.regions
stats = library.stats
/Users/lee1043/mambaforge/envs/pmp_devel_20240425/lib/python3.10/site-packages/pcmdi_metrics/variability_mode/lib/lib_variability_mode.py:259: UserWarning: pcmdi_metrics.variability_modes.lib.sort_human will be deprecated. Please use pcmdi_metrics.utils.sort_human, instead.
  warnings.warn(
Warning: The provided level value 20000 appears to be in Pa. It will be automatically converted to hPa by dividing by 100.
Warning: The provided level value 85000 appears to be in Pa. It will be automatically converted to hPa by dividing by 100.
Warning: The provided level value 20000 appears to be in Pa. It will be automatically converted to hPa by dividing by 100.
Warning: The provided level value 85000 appears to be in Pa. It will be automatically converted to hPa by dividing by 100.
Warning: The provided level value 20000 appears to be in Pa. It will be automatically converted to hPa by dividing by 100.
Warning: The provided level value 85000 appears to be in Pa. It will be automatically converted to hPa by dividing by 100.
Warning: The provided level value 50000 appears to be in Pa. It will be automatically converted to hPa by dividing by 100.
[6]:
print('var_list:', var_list)
print('var_unit_list:', var_unit_list)
var_list: ['pr', 'prw', 'psl', 'rlds', 'rltcre', 'rlus', 'rlut', 'rlutcs', 'rsds', 'rsdscs', 'rsdt', 'rstcre', 'rsut', 'rsutcs', 'sfcWind', 'ta-200', 'ta-850', 'tas', 'tauu', 'ts', 'ua-200', 'ua-850', 'va-200', 'va-850', 'zg-500']
var_unit_list: ['pr [N/A]', 'prw [N/A]', 'psl [N/A]', 'rlds [N/A]', 'rltcre [W m-2]', 'rlus [N/A]', 'rlut [N/A]', 'rlutcs [N/A]', 'rsds [N/A]', 'rsdscs [N/A]', 'rsdt [N/A]', 'rstcre [W m-2]', 'rsut [N/A]', 'rsutcs [N/A]', 'sfcWind [N/A]', 'ta-200 [N/A]', 'ta-850 [N/A]', 'tas [N/A]', 'tauu [N/A]', 'ts [N/A]', 'ua-200 [N/A]', 'ua-850 [N/A]', 'va-200 [N/A]', 'va-850 [N/A]', 'zg-500 [N/A]']
[7]:
df_dict['rms_xy']['djf']['global']
[7]:
| model | run | model_run | pr | prw | psl | rlds | rltcre | rlus | rlut | ... | ta-200 | ta-850 | tas | tauu | ts | ua-200 | ua-850 | va-200 | va-850 | zg-500 | |
|---|---|---|---|---|---|---|---|---|---|---|---|---|---|---|---|---|---|---|---|---|---|
| 0 | ACCESS-CM2 | r1i1p1 | ACCESS-CM2_r1i1p1 | 1.661 | 139.039 | 245.952 | 11.552 | 8.519 | 10.560 | 10.991 | ... | 2.717 | 1.495 | 2.508 | 0.040 | 2.770 | 4.174 | 1.421 | 1.689 | 0.799 | 26.053 |
| 1 | ACCESS-ESM1-5 | r1i1p1 | ACCESS-ESM1-5_r1i1p1 | 1.739 | 139.068 | 215.795 | 10.553 | 7.358 | 10.352 | 10.875 | ... | 2.551 | 1.335 | 2.106 | 0.035 | 2.250 | 3.305 | 1.408 | 1.804 | 0.859 | 25.470 |
| 2 | AWI-CM-1-1-MR | r1i1p1 | AWI-CM-1-1-MR_r1i1p1 | 1.604 | 139.179 | 170.936 | 11.231 | 7.957 | 8.496 | 8.960 | ... | 1.847 | 1.074 | 1.414 | 0.028 | 1.609 | 2.483 | 1.251 | 1.586 | 0.711 | 16.738 |
| 3 | AWI-ESM-1-1-LR | r1i1p1 | AWI-ESM-1-1-LR_r1i1p1 | 1.937 | 139.199 | 201.589 | 14.743 | 8.935 | 12.495 | 11.630 | ... | 3.966 | 2.224 | 2.039 | 0.034 | 2.317 | 3.835 | 1.684 | 2.241 | 1.024 | NaN |
| 4 | BCC-CSM2-MR | r1i1p1 | BCC-CSM2-MR_r1i1p1 | 1.700 | 139.251 | 237.180 | 13.025 | 7.370 | 11.014 | 9.984 | ... | NaN | NaN | 2.669 | 0.034 | 2.585 | NaN | NaN | NaN | NaN | NaN |
| 5 | BCC-ESM1 | r1i1p1 | BCC-ESM1_r1i1p1 | 1.631 | 139.152 | 237.973 | 14.469 | 8.423 | 12.970 | 12.763 | ... | 4.343 | 2.055 | 3.211 | 0.038 | 3.188 | 4.673 | 1.849 | 2.119 | 1.118 | NaN |
| 6 | CAMS-CSM1-0 | r1i1p1 | CAMS-CSM1-0_r1i1p1 | 1.721 | 139.513 | 182.945 | 19.644 | 8.397 | 14.631 | 11.507 | ... | NaN | NaN | 3.462 | NaN | 3.858 | NaN | NaN | NaN | NaN | NaN |
| 7 | CanESM5 | r1i1p1 | CanESM5_r1i1p1 | 1.779 | 138.924 | 240.049 | 16.095 | 8.406 | 12.479 | 11.047 | ... | 3.066 | 1.905 | 2.465 | 0.055 | 2.622 | 4.055 | 1.706 | 2.013 | 1.008 | 32.574 |
| 8 | CESM2 | r1i1p1 | CESM2_r1i1p1 | 1.234 | 139.212 | 210.704 | 11.026 | 6.979 | 9.611 | 7.908 | ... | 2.057 | 1.309 | 1.483 | 0.089 | 1.800 | 3.433 | 1.377 | 1.973 | 0.800 | NaN |
| 9 | CESM2-FV2 | r1i1p1 | CESM2-FV2_r1i1p1 | 1.397 | 139.161 | 242.138 | 12.376 | 7.835 | 10.690 | 8.740 | ... | 3.026 | 1.987 | 1.892 | 0.090 | 2.142 | 4.017 | 2.061 | 2.204 | 0.988 | NaN |
| 10 | CESM2-WACCM | r1i1p1 | CESM2-WACCM_r1i1p1 | 1.203 | 139.166 | 205.141 | 10.544 | 6.761 | 9.166 | 7.680 | ... | NaN | NaN | 1.462 | 0.088 | 1.750 | 3.131 | 1.481 | 1.761 | 0.787 | NaN |
| 11 | CESM2-WACCM-FV2 | r1i1p1 | CESM2-WACCM-FV2_r1i1p1 | 1.517 | 139.211 | 194.140 | 12.047 | 7.890 | 10.551 | 9.264 | ... | NaN | NaN | 1.744 | 0.089 | 2.095 | 3.086 | 1.871 | 1.976 | 0.903 | 22.056 |
| 12 | CIESM | r1i1p1 | CIESM_r1i1p1 | 3.627 | 139.554 | 175.697 | 10.636 | 8.130 | 8.867 | 7.649 | ... | 3.773 | 1.221 | 1.512 | 0.151 | 1.802 | 3.106 | 1.264 | 1.635 | 0.834 | 39.275 |
| 13 | CMCC-CM2-HR4 | r1i1p1 | CMCC-CM2-HR4_r1i1p1 | 1.599 | 139.313 | 327.559 | 13.640 | 8.576 | 9.807 | 10.873 | ... | 3.350 | 1.575 | 1.675 | 0.175 | 1.865 | 4.592 | 2.092 | 2.294 | 1.140 | 41.643 |
| 14 | CMCC-CM2-SR5 | r1i1p1 | CMCC-CM2-SR5_r1i1p1 | 1.529 | 139.410 | 294.997 | 11.556 | 8.437 | 10.053 | 8.629 | ... | 3.479 | 1.774 | 1.903 | 0.150 | 2.216 | 3.781 | 1.530 | 1.770 | 0.886 | 29.599 |
| 15 | E3SM-1-0 | r1i1p1 | E3SM-1-0_r1i1p1 | 1.358 | 139.355 | 263.067 | 13.937 | 6.388 | 10.892 | 7.968 | ... | 2.954 | 2.322 | 2.156 | 0.048 | 2.312 | 3.283 | 1.538 | 1.759 | 0.846 | 31.321 |
| 16 | E3SM-1-1 | r1i1p1 | E3SM-1-1_r1i1p1 | 1.384 | 139.305 | 286.393 | 14.353 | 6.715 | 11.588 | 8.222 | ... | 3.055 | NaN | 2.293 | 0.037 | 2.429 | 3.477 | NaN | 1.954 | NaN | 33.610 |
| 17 | E3SM-1-1-ECA | r1i1p1 | E3SM-1-1-ECA_r1i1p1 | 1.349 | 139.318 | 277.138 | 14.140 | 6.519 | 11.746 | 8.159 | ... | 3.094 | 26.727 | 2.367 | 0.037 | 2.507 | 3.483 | 1.555 | 1.871 | 0.885 | 36.308 |
| 18 | EC-Earth3 | r1i1p1 | EC-Earth3_r1i1p1 | 1.239 | 139.257 | 167.478 | 15.160 | 6.863 | 12.768 | 9.741 | ... | 1.701 | 1.755 | 2.450 | 0.024 | 3.674 | 3.163 | 0.991 | 1.662 | 0.677 | 31.607 |
| 19 | EC-Earth3-AerChem | r1i1p1 | EC-Earth3-AerChem_r1i1p1 | 1.291 | 139.269 | 176.365 | 14.411 | 6.825 | 12.037 | 9.629 | ... | NaN | NaN | 2.229 | 0.025 | 3.634 | 3.352 | 1.033 | 1.599 | 0.669 | 33.658 |
| 20 | EC-Earth3-Veg | r1i1p1 | EC-Earth3-Veg_r1i1p1 | 1.262 | 139.308 | 159.077 | 13.688 | 6.945 | 11.592 | 9.661 | ... | 1.613 | 1.635 | 2.004 | 0.026 | 3.610 | 3.315 | 1.015 | 1.534 | 0.677 | 28.996 |
| 21 | EC-Earth3-Veg-LR | r1i1p1 | EC-Earth3-Veg-LR_r1i1p1 | 1.266 | 139.286 | 158.686 | 16.394 | 6.922 | 13.260 | 10.065 | ... | 2.019 | 1.797 | 2.502 | 0.024 | 3.708 | 3.264 | 1.098 | 1.591 | 0.706 | 33.999 |
| 22 | FGOALS-f3-L | r1i1p1 | FGOALS-f3-L_r1i1p1 | 1.449 | NaN | 359.037 | 11.759 | 10.375 | 12.101 | 10.129 | ... | 3.215 | 1.683 | 2.779 | 0.171 | 2.889 | 4.494 | 1.693 | 2.272 | 0.973 | 54.113 |
| 23 | FGOALS-g3 | r1i1p1 | FGOALS-g3_r1i1p1 | 1.658 | 138.888 | 292.081 | 19.393 | 9.125 | 15.059 | 12.801 | ... | 5.826 | 1.823 | 3.562 | 0.163 | 3.895 | 3.641 | 1.909 | 2.136 | 1.050 | 29.997 |
| 24 | FIO-ESM-2-0 | r1i1p1 | FIO-ESM-2-0_r1i1p1 | 1.388 | NaN | 228.979 | 10.459 | 7.668 | 8.932 | 9.352 | ... | 3.792 | 1.551 | 1.586 | 0.151 | 1.776 | 3.900 | 1.462 | 2.196 | 0.890 | 26.022 |
| 25 | GFDL-CM4 | r1i1p1 | GFDL-CM4_r1i1p1 | 1.337 | 139.040 | 196.965 | 14.900 | 6.849 | 9.760 | 8.148 | ... | 2.109 | 1.830 | 2.331 | 0.027 | 2.226 | 2.844 | 1.379 | 1.323 | 0.707 | 42.543 |
| 26 | GFDL-ESM4 | r1i1p1 | GFDL-ESM4_r1i1p1 | 1.375 | 139.071 | 204.671 | 12.807 | 6.885 | 9.041 | 8.459 | ... | NaN | NaN | 2.034 | 0.028 | 2.067 | 2.754 | 1.376 | 1.457 | 0.730 | NaN |
| 27 | GISS-E2-1-G | r1i1p1 | GISS-E2-1-G_r1i1p1 | 1.631 | 139.025 | 302.630 | 15.092 | 9.973 | 12.631 | 11.219 | ... | 3.685 | 2.058 | 2.643 | 0.047 | 2.867 | 5.480 | 1.832 | 2.889 | 1.128 | 46.220 |
| 28 | GISS-E2-1-G-CC | r1i1p1 | GISS-E2-1-G-CC_r1i1p1 | 1.699 | 139.058 | 302.395 | 15.650 | 10.280 | 12.949 | 11.922 | ... | 3.737 | 2.034 | 2.663 | 0.046 | 2.905 | 5.951 | 1.898 | 3.107 | 1.159 | 45.968 |
| 29 | GISS-E2-1-H | r1i1p1 | GISS-E2-1-H_r1i1p1 | 1.675 | 139.224 | 486.524 | 16.427 | 9.876 | 13.117 | 11.333 | ... | 3.881 | 1.990 | 2.482 | 0.050 | 2.806 | 5.074 | 1.890 | 2.974 | 1.166 | 56.408 |
| 30 | INM-CM4-8 | r1i1p1 | INM-CM4-8_r1i1p1 | 1.724 | 139.201 | 243.852 | 18.399 | 10.049 | 11.774 | 12.460 | ... | 3.799 | 2.989 | 2.597 | 0.074 | 2.769 | 5.865 | 2.035 | 2.760 | 1.199 | 52.334 |
| 31 | INM-CM5-0 | r1i1p1 | INM-CM5-0_r1i1p1 | 1.667 | 139.189 | 197.334 | 16.972 | 8.735 | 10.580 | 10.378 | ... | NaN | NaN | 2.199 | 0.071 | 2.380 | 4.022 | 1.688 | 2.309 | 1.074 | 51.208 |
| 32 | IPSL-CM6A-LR | r1i1p1 | IPSL-CM6A-LR_r1i1p1 | 1.625 | 139.137 | 240.321 | 13.602 | 7.105 | 9.523 | 8.710 | ... | NaN | NaN | 2.073 | 0.036 | 1.987 | 3.033 | 1.661 | 1.803 | 0.973 | 63.596 |
| 33 | KACE-1-0-G | r1i1p1 | KACE-1-0-G_r1i1p1 | 1.457 | 139.082 | 208.175 | 11.662 | 8.174 | 11.210 | 10.097 | ... | 3.300 | 1.399 | 2.462 | 0.036 | 2.715 | 3.707 | 1.346 | 1.845 | 0.825 | 23.343 |
| 34 | MCM-UA-1-0 | r1i1p1 | MCM-UA-1-0_r1i1p1 | 1.605 | NaN | 355.577 | NaN | NaN | NaN | 14.301 | ... | 2.990 | 4.290 | 3.190 | 0.150 | 3.289 | 4.458 | 1.929 | 2.470 | 1.142 | 63.850 |
| 35 | MIROC6 | r1i1p1 | MIROC6_r1i1p1 | 1.411 | 139.478 | 371.381 | 11.968 | 6.001 | 11.836 | 13.347 | ... | NaN | NaN | 2.566 | 0.079 | 2.882 | 3.742 | 1.539 | 1.891 | 0.931 | NaN |
| 36 | MPI-ESM-1-2-HAM | r1i1p1 | MPI-ESM-1-2-HAM_r1i1p1 | 1.935 | 139.333 | 182.547 | 13.682 | 9.330 | 11.438 | 11.509 | ... | 5.209 | 2.242 | 2.071 | 0.034 | 2.339 | 3.703 | 1.602 | 1.835 | 0.942 | 35.808 |
| 37 | MPI-ESM1-2-HR | r1i1p1 | MPI-ESM1-2-HR_r1i1p1 | 1.558 | 139.185 | 175.940 | 11.483 | 7.972 | 8.214 | 9.257 | ... | 1.855 | 1.226 | 1.518 | 0.029 | 1.667 | 3.610 | 1.464 | 1.869 | 0.785 | NaN |
| 38 | MPI-ESM1-2-LR | r1i1p1 | MPI-ESM1-2-LR_r1i1p1 | 1.586 | 139.240 | 169.975 | 12.861 | 7.665 | 9.964 | 9.711 | ... | 3.753 | 1.650 | 1.675 | 0.031 | 1.981 | 3.258 | 1.405 | 1.842 | 0.879 | 25.125 |
| 39 | MRI-ESM2-0 | r1i1p1 | MRI-ESM2-0_r1i1p1 | 1.542 | 139.105 | 262.614 | 12.888 | 7.231 | 9.446 | 9.306 | ... | NaN | NaN | 1.619 | 0.033 | 1.820 | 5.641 | 2.041 | 2.302 | 0.942 | NaN |
| 40 | NESM3 | r1i1p1 | NESM3_r1i1p1 | 1.958 | 139.286 | 252.038 | 16.135 | 11.223 | 13.198 | 15.035 | ... | 3.635 | 2.314 | 2.673 | 0.040 | 2.878 | 5.600 | 2.080 | 2.459 | 1.177 | 33.842 |
| 41 | NorCPM1 | r1i1p1 | NorCPM1_r1i1p1 | 1.562 | 139.040 | 302.481 | 16.905 | 10.218 | 13.985 | 13.010 | ... | 4.101 | 2.341 | 2.775 | 0.039 | 3.017 | 3.423 | 2.401 | 2.197 | 1.290 | 27.684 |
| 42 | NorESM2-MM | r1i1p1 | NorESM2-MM_r1i1p1 | 0.995 | 139.146 | 187.760 | 11.090 | 6.325 | 8.893 | 7.007 | ... | NaN | NaN | 1.900 | 0.032 | 2.038 | 3.128 | 1.273 | NaN | 0.828 | 19.449 |
| 43 | SAM0-UNICON | r1i1p1 | SAM0-UNICON_r1i1p1 | 1.444 | 139.142 | 238.562 | 13.340 | 9.123 | 11.336 | 10.244 | ... | 3.560 | 1.479 | 2.478 | 0.036 | 2.609 | 3.293 | 1.736 | 2.036 | 0.939 | 23.985 |
| 44 | TaiESM1 | r1i1p1 | TaiESM1_r1i1p1 | 1.335 | 139.102 | 211.710 | 11.730 | 8.043 | 10.044 | 8.601 | ... | NaN | NaN | 2.243 | 0.044 | 2.406 | NaN | 1.508 | NaN | 0.814 | NaN |
45 rows × 28 columns
[8]:
#var_list = ["pr", "psl", "rltcre", "rlut", "rstcre", "rsut", "ta-200", "ta-850", "tas", "ts",
#            "ua-200", "ua-850", "va-200", "va-850", "zg-500"]
[9]:
# Simple re-order variables
if 'zg-500' in var_list and 'sfcWind' in var_list:
    var_list.remove('zg-500')
    idx_sfcWind = var_list.index('sfcWind')
    var_list.insert(idx_sfcWind+1, 'zg-500')

print("var_list:", var_list)
var_list: ['pr', 'prw', 'psl', 'rlds', 'rltcre', 'rlus', 'rlut', 'rlutcs', 'rsds', 'rsdscs', 'rsdt', 'rstcre', 'rsut', 'rsutcs', 'sfcWind', 'zg-500', 'ta-200', 'ta-850', 'tas', 'tauu', 'ts', 'ua-200', 'ua-850', 'va-200', 'va-850']
[10]:
data_djf = df_dict['rms_xy']['djf']['global'][var_list].to_numpy()
data_mam = df_dict['rms_xy']['mam']['global'][var_list].to_numpy()
data_jja = df_dict['rms_xy']['jja']['global'][var_list].to_numpy()
data_son = df_dict['rms_xy']['son']['global'][var_list].to_numpy()
model_names = df_dict['rms_xyt']['ann']['global']['model'].tolist()
data_all = np.stack([data_djf, data_mam, data_jja, data_son])
print('data.shape:', data_all.shape)
print('len(var_list): ', len(var_list))
print('len(model_names): ', len(model_names))

xaxis_labels = var_list
yaxis_labels = model_names
data.shape: (4, 45, 25)
len(var_list):  25
len(model_names):  45
1.4 Normalize each column by its median
Use normalize_by_median function.
Parameters
data: 2d numpy arrayaxis: 0 (normalize each column) or 1 (normalize each row), default=0
Return
data_nor: 2d numpy array
[11]:
from pcmdi_metrics.graphics import normalize_by_median

data_djf_nor = normalize_by_median(data_djf)
data_mam_nor = normalize_by_median(data_mam)
data_jja_nor = normalize_by_median(data_jja)
data_son_nor = normalize_by_median(data_son)
[12]:
data_all_nor = np.stack([data_djf_nor, data_mam_nor, data_jja_nor, data_son_nor])
data_all_nor.shape
[12]:
(4, 45, 25)
2. Matplotlib-based PMP Visualization Function
[13]:
from pcmdi_metrics.graphics import portrait_plot
Parameters
data: 2d numpy array, a list of 2d numpy arrays, or a 3d numpy array (i.e. stacked 2d numpy arrays)xaxis_labels: list of strings, labels for xaixs. Number of list element must consistent to x-axis, or 0 (empty list) to turn off xaxis tick labelsyaxis_labels: list of strings, labels for yaxis. Number of list element must consistent to y-axis, or 0 (empty list) to turn off yaxis tick labelsfig:`matplotlib.figure<https://matplotlib.org/stable/api/_as_gen/matplotlib.pyplot.figure.html>`__ instance to which the portrait plot is plotted. If not provided, use current axes or create a new one. Optional.ax:`matplotlib.axes.Axes<https://matplotlib.org/stable/api/axes_api.html>`__ instance to which the portrait plot is plotted. If not provided, use current axes or create a new one. Optional.annotate: bool, default=False, add annotating text if true, but work only for heatmap style map (i.e., no triangles)annotate_data: 2d numpy array, default=None. If None, the image’s data is used. Optional.annotate_fontsize: number (int/float), default=15. Font size for annotationannotate_format: format for annotate value, default=”{x:.2f}”figsize: tuple of two numbers (width, height), default=(12, 10), figure size in inchesvrange: tuple of two numbers, range of value for colorbar. Optional.xaxis_fontsize: number, default=15, font size for xaxis tick labelsyaxis_fontsize: number, default=15, font size for yaxis tick labelscmap: string, default=”RdBu_r”, name of matplotlib colormapcmap_bounds: list of numbers. If given, discrete colors are applied. Optional.cbar_label: string, default=None, label for colorbarcbar_label_fontsize: number, default=15, font size for colorbar labelscbar_tick_fontsize: number, default=12, font size for colorbar tick labelscbar_kw: A dictionary with arguments to`matplotlib.Figure.colorbar<https://matplotlib.org/stable/api/_as_gen/matplotlib.pyplot.colorbar.html>`__. Optional.colorbar_off: Trun off colorbar if True. Optional.missing_color: color, default=”grey”,`matplotlib.axes.Axes.set_facecolor<https://matplotlib.org/stable/api/_as_gen/matplotlib.axes.Axes.set_facecolor.html>`__ parameterinvert_yaxis: bool, default=True, place y=0 at top on the plotbox_as_square: bool, default=False, make each box as squarelegend_on: bool, default=False, show legend (only for 2 or 4 triangles portrait plot)legend_labels: list of strings, legend labels for trianglslegend_box_xy: tuple of numbers, position of legend box’s upper-left corner (lower-left ifinvert_yaxis=False), inaxescoordinatelegend_box_size: number, size of legend boxlegend_lw: number, line width of legend, default=1legend_fontsize: number, font size for legend, default=14logo_rect: sequence of float. The dimensions [left, bottom, width, height] of the PMP logo. All quantities are in fractions of figure width and height. Optionallogo_off: bool, default=False, turn off PMP logodebug: bool, default=False, if true print more message when running that help debugging
Return
fig: matplotlib component for figureax: matplotlib component for axiscbar: matplotlib component for colorbar (not returned if colorbar_off=True)
3. Plot
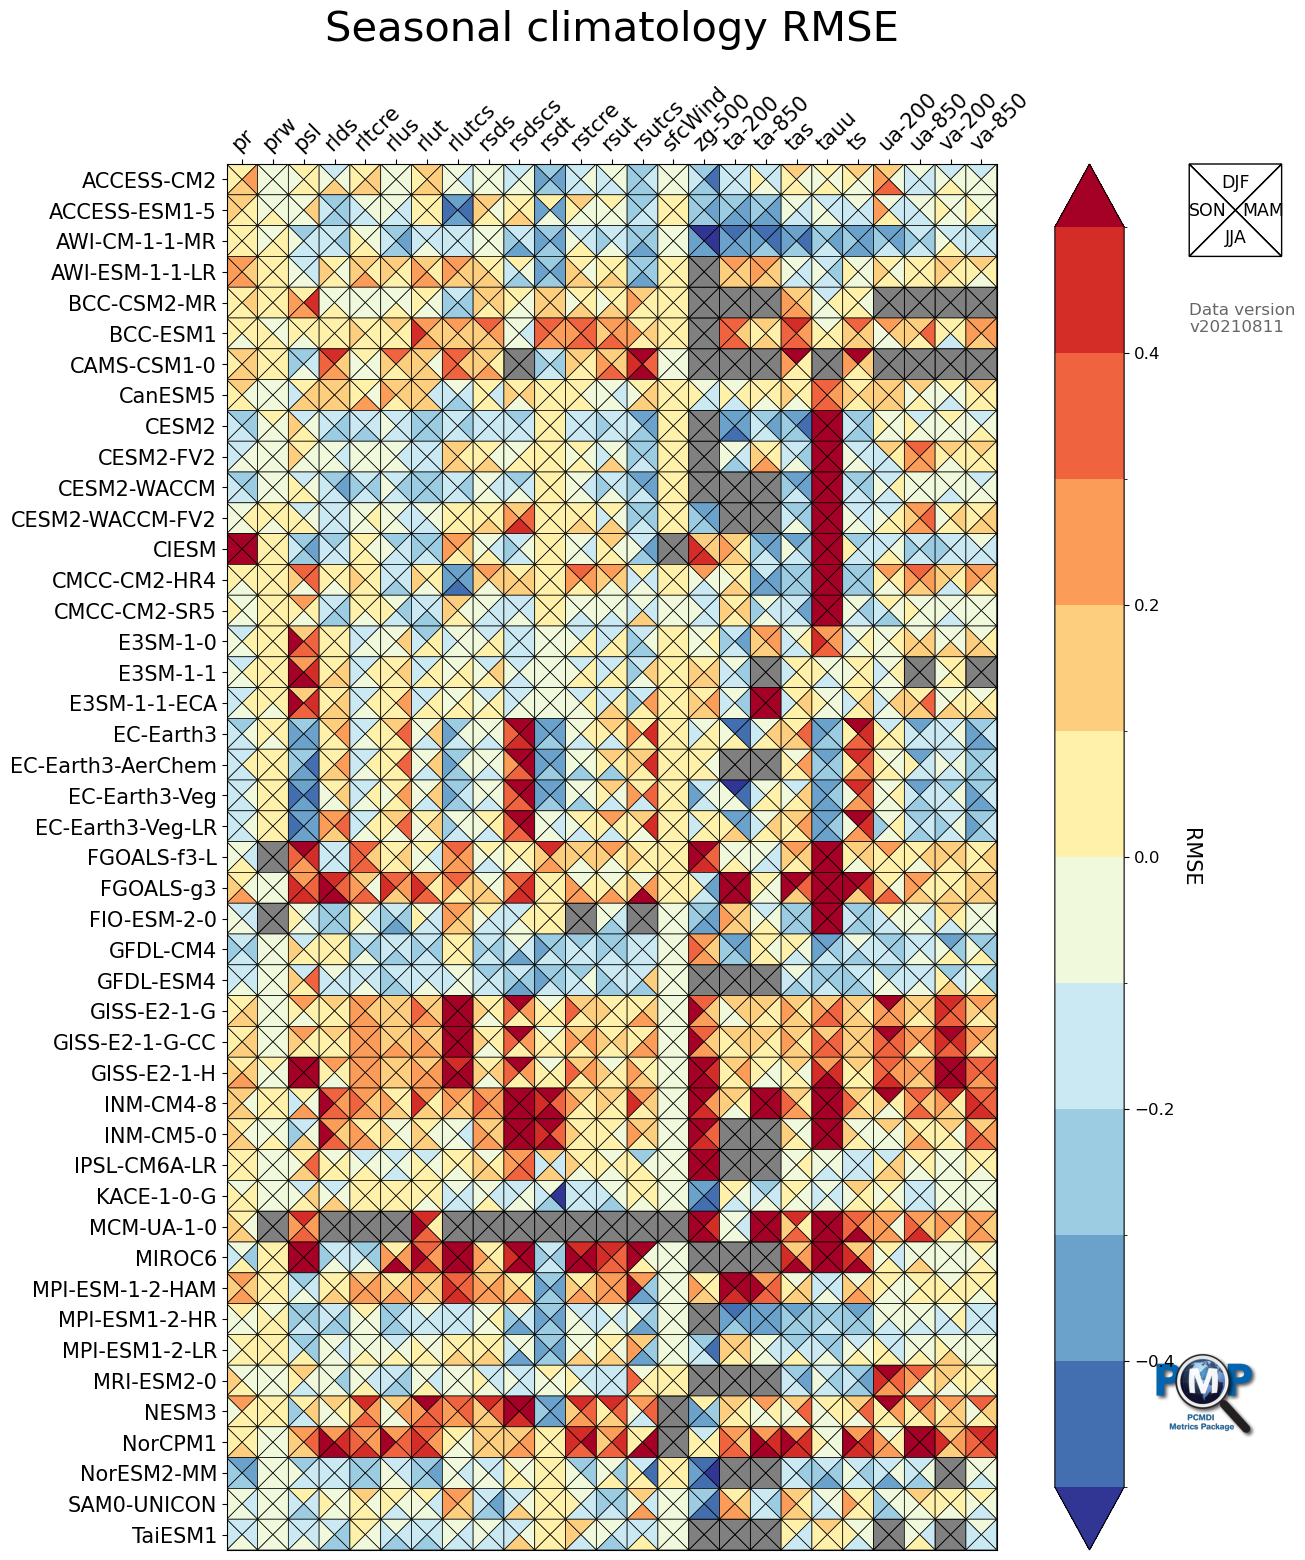
3.1 Portrait Plot with 4 Triangles (4 seasons)
data order is clockwise from top: top, right, bottom, left
[14]:
fig, ax, cbar = portrait_plot(data_all_nor,
                              xaxis_labels=xaxis_labels,
                              yaxis_labels=yaxis_labels,
                              cbar_label='RMSE',
                              box_as_square=True,
                              vrange=(-0.5, 0.5),
                              figsize=(15, 18),
                              cmap='RdYlBu_r',
                              cmap_bounds=[-0.5, -0.4, -0.3, -0.2, -0.1, 0, 0.1, 0.2, 0.3, 0.4, 0.5],
                              cbar_kw={"extend": "both"},
                              missing_color='grey',
                              legend_on=True,
                              legend_labels=['DJF', 'MAM', 'JJA', 'SON'],
                              legend_box_xy=(1.25, 1),
                              legend_box_size=3,
                              legend_lw=1,
                              legend_fontsize=12.5,
                              logo_rect = [0.85, 0.15, 0.07, 0.07]
                             )
ax.set_xticklabels(xaxis_labels, rotation=45, va='bottom', ha="left")

# Add title
ax.set_title("Seasonal climatology RMSE", fontsize=30, pad=30)

# Add data info
fig.text(1.25, 0.9, 'Data version\n'+data_version, transform=ax.transAxes,
         fontsize=12, color='black', alpha=0.6, ha='left', va='top',)
[14]:
Text(1.25, 0.9, 'Data version\nv20210811')

[15]:
# Save figure as an image file
fig.savefig('mean_clim_portrait_plot_4seasons_'+data_version+'.png', facecolor='w', bbox_inches='tight')
[16]:
# Add Watermark
ax.text(0.5, 0.5, 'Example', transform=ax.transAxes,
        fontsize=100, color='black', alpha=0.6,
        ha='center', va='center', rotation=0)
# Save figure as an image file
fig.savefig('mean_clim_portrait_plot_4seasons_example.png', facecolor='w', bbox_inches='tight')
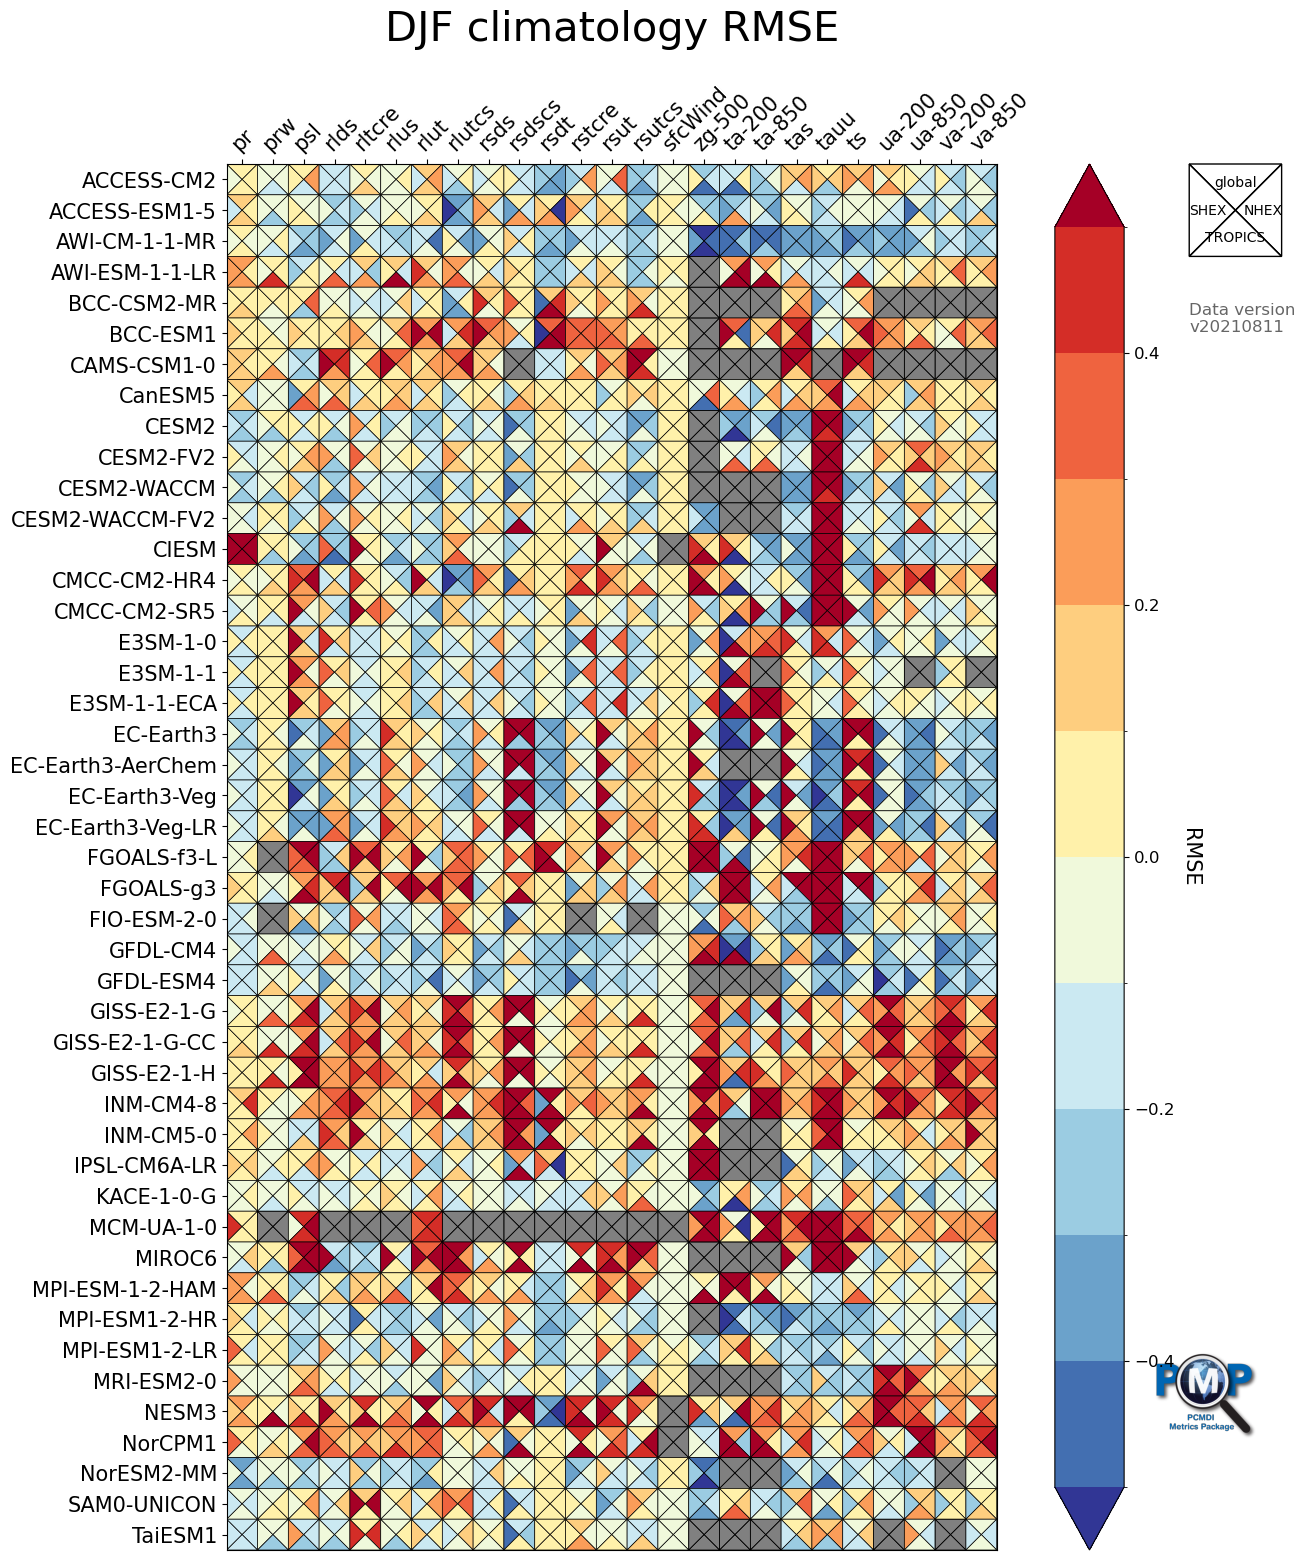
3.2 Portrait Plot with 4 Triangles (4 regions)
[17]:
stat = 'rms_xy'
regions = ['global', 'NHEX', 'TROPICS', 'SHEX']

data1 = normalize_by_median(df_dict[stat]['djf']['global'][var_list].to_numpy())
data2 = normalize_by_median(df_dict[stat]['djf']['NHEX'][var_list].to_numpy())
data3 = normalize_by_median(df_dict[stat]['djf']['TROPICS'][var_list].to_numpy())
data4 = normalize_by_median(df_dict[stat]['djf']['SHEX'][var_list].to_numpy())

data_regions_nor = np.stack([data1, data2, data3, data4])

fig, ax, cbar = portrait_plot(data_regions_nor,
                              xaxis_labels=xaxis_labels,
                              yaxis_labels=yaxis_labels,
                              cbar_label='RMSE',
                              box_as_square=True,
                              vrange=(-0.5, 0.5),
                              figsize=(15, 18),
                              cmap='RdYlBu_r',
                              cmap_bounds=[-0.5, -0.4, -0.3, -0.2, -0.1, 0, 0.1, 0.2, 0.3, 0.4, 0.5],
                              cbar_kw={"extend": "both"},
                              missing_color='grey',
                              legend_on=True,
                              legend_labels=regions,
                              legend_box_xy=(1.25, 1),
                              legend_box_size=3,
                              legend_lw=1,
                              legend_fontsize=10,
                              logo_rect = [0.85, 0.15, 0.07, 0.07]
                             )
ax.set_xticklabels(xaxis_labels, rotation=45, va='bottom', ha="left")

# Add title
ax.set_title("DJF climatology RMSE", fontsize=30, pad=30)

# Add data info
fig.text(1.25, 0.9, 'Data version\n'+data_version, transform=ax.transAxes,
         fontsize=12, color='black', alpha=0.6, ha='left', va='top',)

# Save figure as an image file
fig.savefig('mean_clim_portrait_plot_4regions_'+data_version+'.png', facecolor='w', bbox_inches='tight')

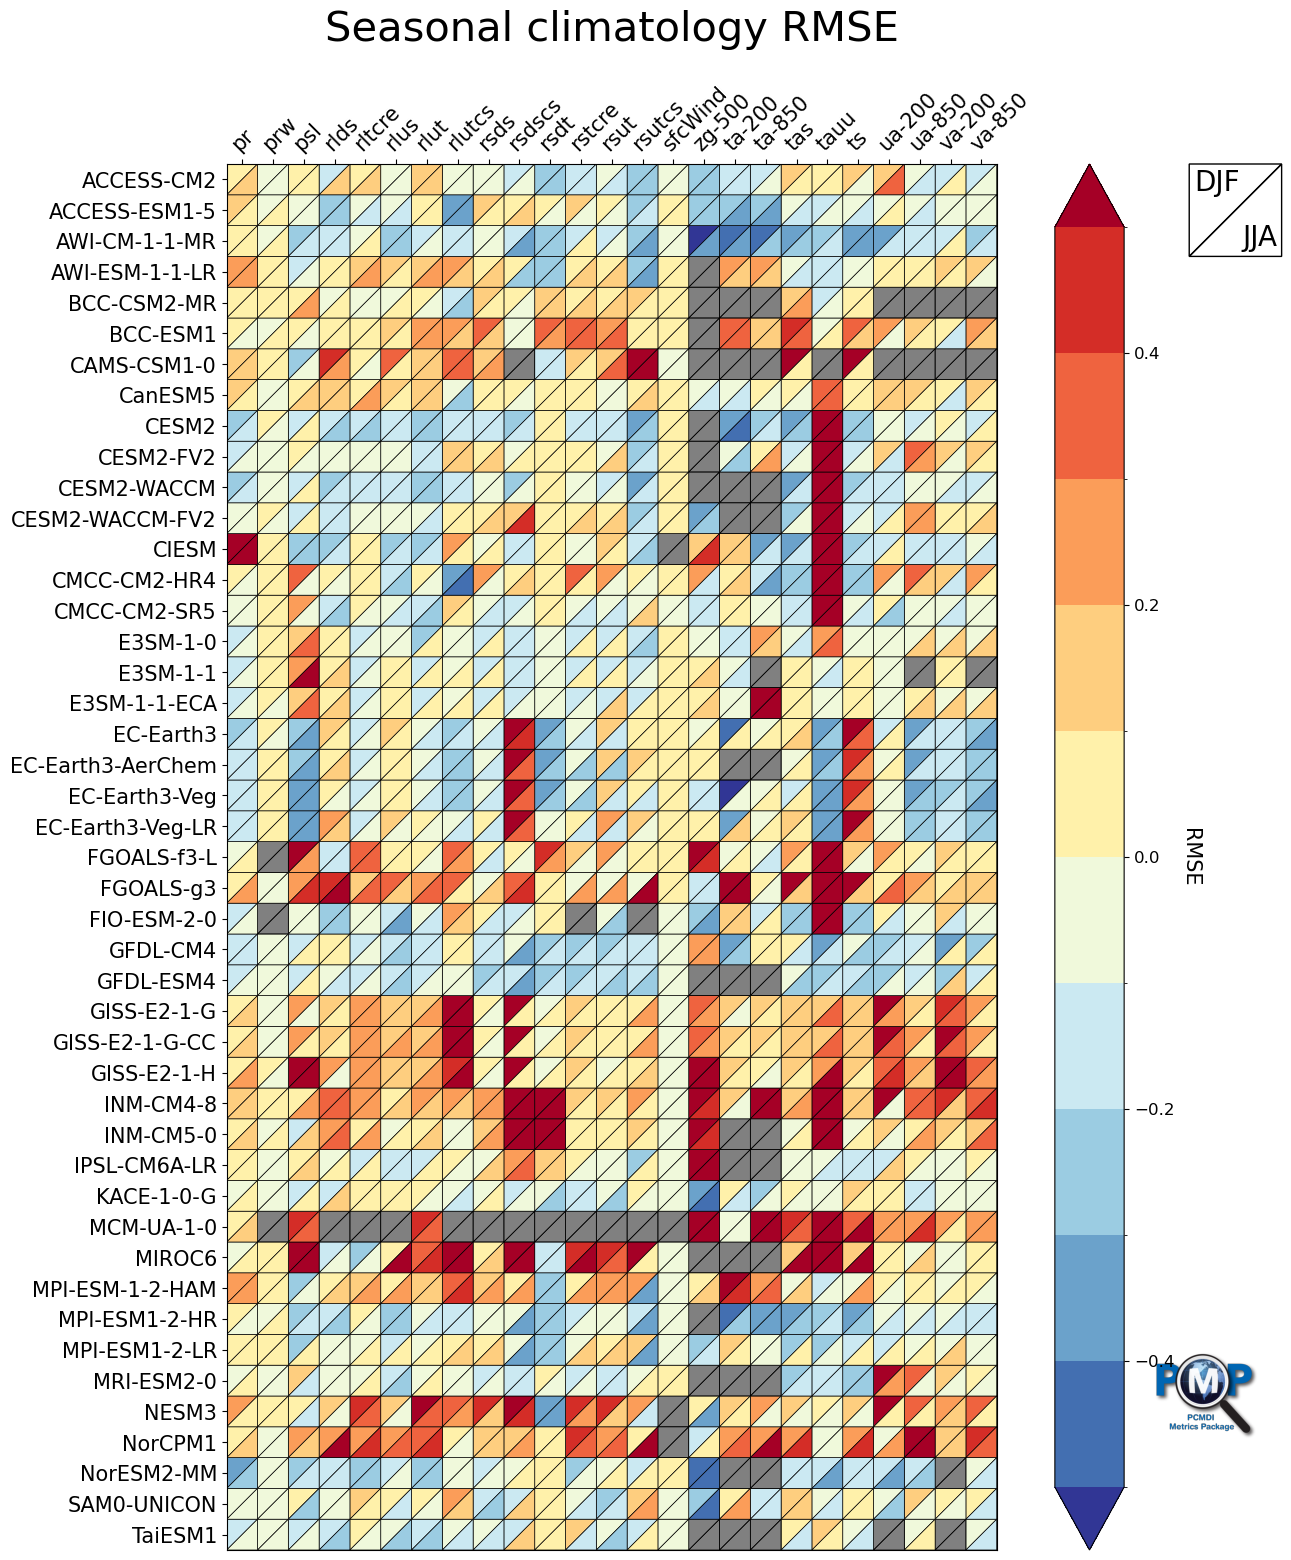
3.3 Portrait Plot with 2 Triangles (2 seasons)
[18]:
fig, ax, cbar = portrait_plot([data_djf_nor, data_jja_nor],
                              xaxis_labels=xaxis_labels,
                              yaxis_labels=yaxis_labels,
                              cbar_label='RMSE',
                              box_as_square=True,
                              vrange=(-0.5, 0.5),
                              figsize=(15, 18),
                              cmap='RdYlBu_r',
                              cmap_bounds=[-0.5, -0.4, -0.3, -0.2, -0.1, 0, 0.1, 0.2, 0.3, 0.4, 0.5],
                              cbar_kw={"extend": "both"},
                              missing_color='grey',
                              legend_on=True,
                              legend_labels=['DJF', 'JJA'],
                              legend_box_xy = (1.25, 1),
                              legend_box_size=3,
                              legend_lw=1,
                              legend_fontsize=20,
                              logo_rect = [0.85, 0.15, 0.07, 0.07]
                             )
ax.set_xticklabels(xaxis_labels, rotation=45, va='bottom', ha="left")

# Add title
ax.set_title("Seasonal climatology RMSE", fontsize=30, pad=30)
[18]:
Text(0.5, 1.0, 'Seasonal climatology RMSE')

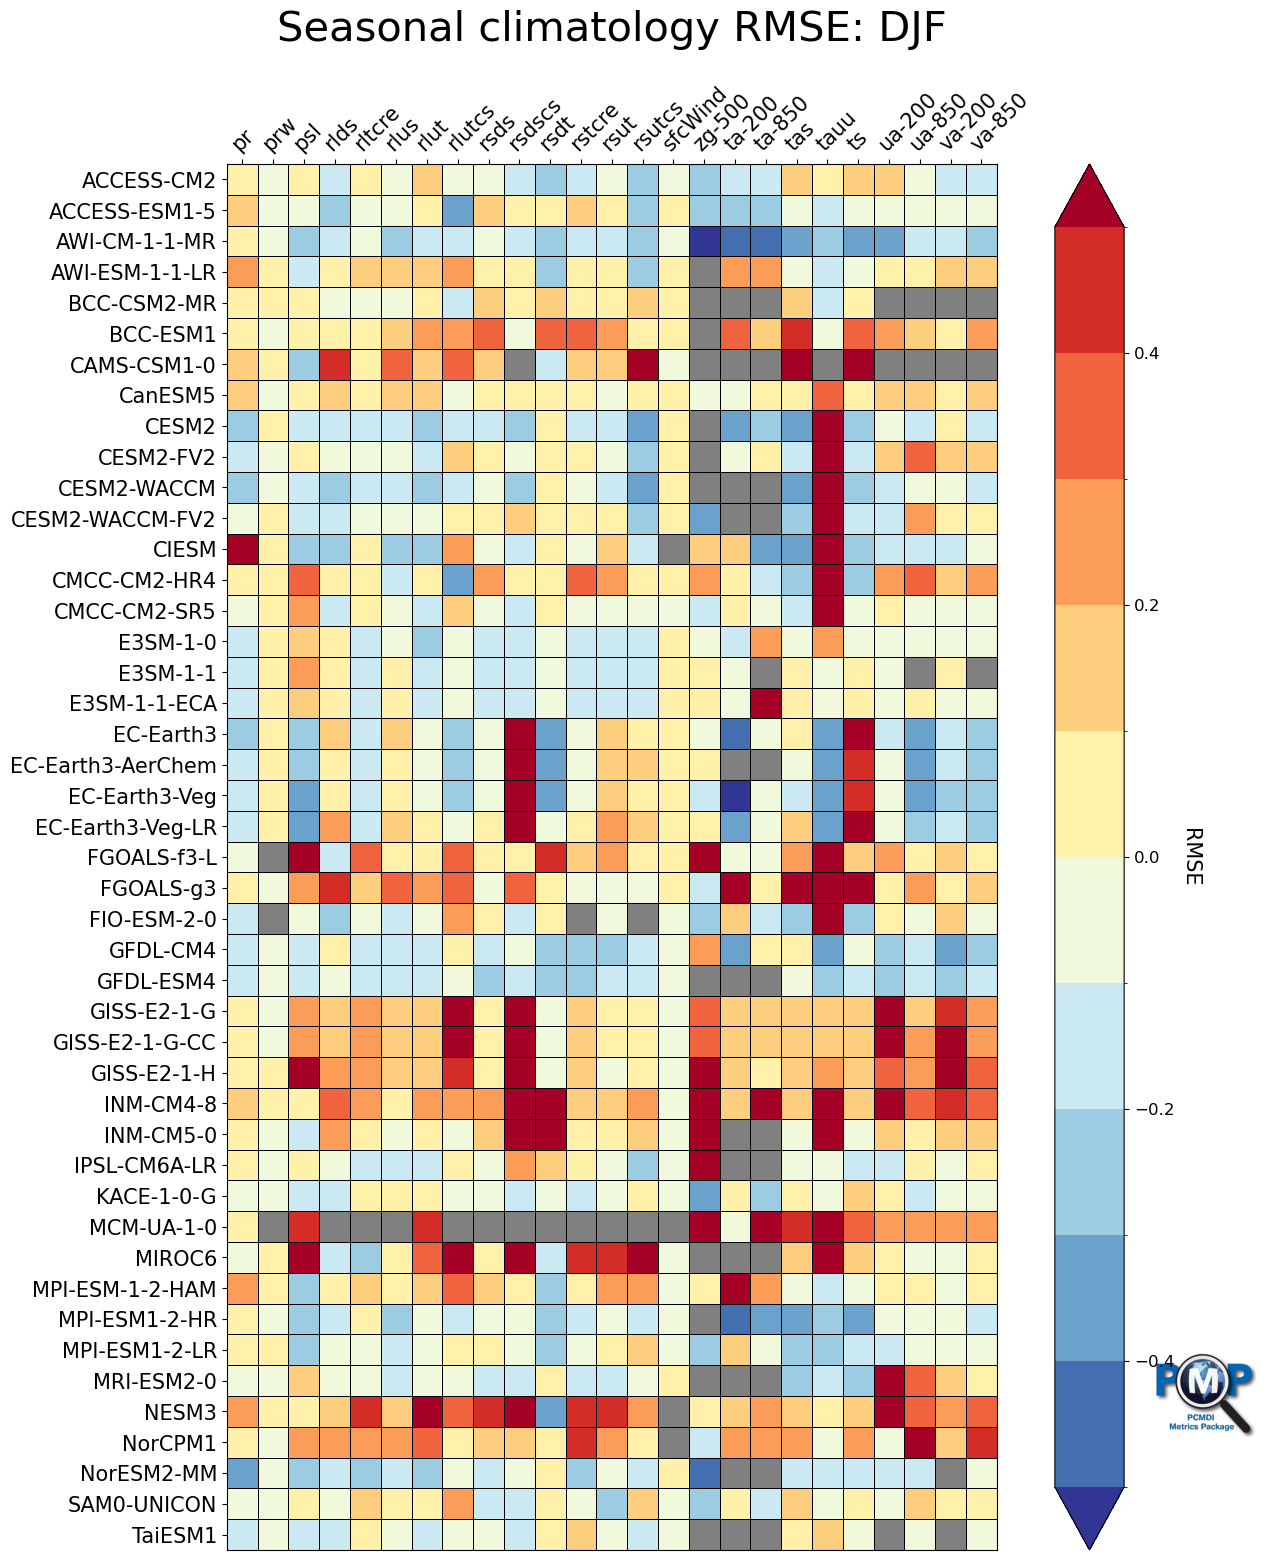
3.4 Portrait Plot without Triangles (1 season)
[19]:
fig, ax, cbar = portrait_plot([data_djf_nor],
                              xaxis_labels=xaxis_labels,
                              yaxis_labels=yaxis_labels,
                              cbar_label='RMSE',
                              box_as_square=True,
                              vrange=(-0.5, 0.5),
                              figsize=(15, 18),
                              cmap='RdYlBu_r',
                              cmap_bounds=[-0.5, -0.4, -0.3, -0.2, -0.1, 0, 0.1, 0.2, 0.3, 0.4, 0.5],
                              cbar_kw={"extend": "both"},
                              missing_color='grey',
                              logo_rect = [0.85, 0.15, 0.07, 0.07]
                             )
ax.set_xticklabels(xaxis_labels, rotation=45, va='bottom', ha="left")

# Add title
ax.set_title("Seasonal climatology RMSE: DJF", fontsize=30, pad=30)
[19]:
Text(0.5, 1.0, 'Seasonal climatology RMSE: DJF')
