Demo notebooks
Metrics
We provide demo notebooks to help users get started with the PMP. Most demos are straightforward examples showing how to apply the PMP to one or more datasets. For more advanced use cases (such as running the PMP across all CMIP models), we include example parameter files based on PCMDI’s semi-operational setup for the CMIP database. Overviews for metrics can be found here.
To make it easier to run these demos, we recommend cloning the PMP GitHub repository, and run them in the environment where PMP is installed.
$ clone https://github.com/PCMDI/pcmdi_metrics.git
$ cd pcmdi_metrics/doc/jupyter/Demo
Demo notebooks:
Plots
We also provide demo notebooks showcasing PMP’s plotting capabilities, and the API reference includes detailed information on the available parameters for PMP’s plotting functions.
Basic Usage Examples
Practical Use Cases
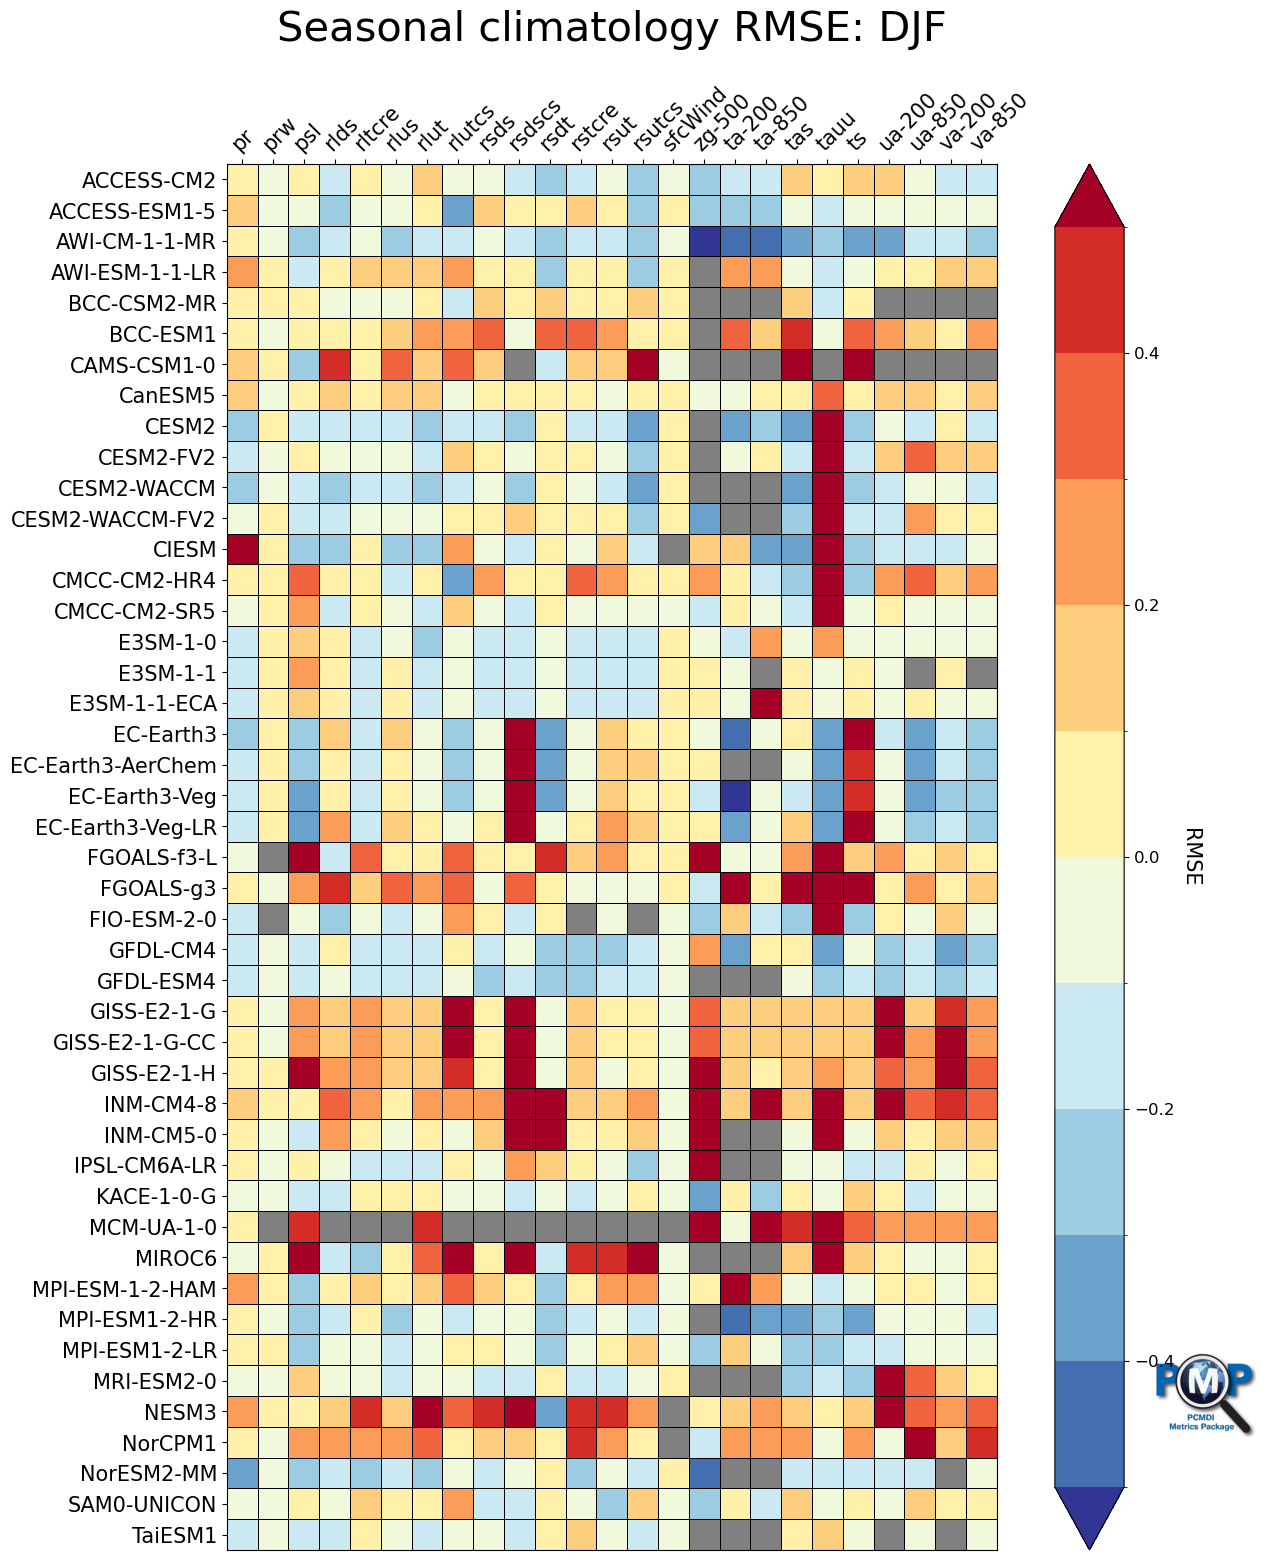
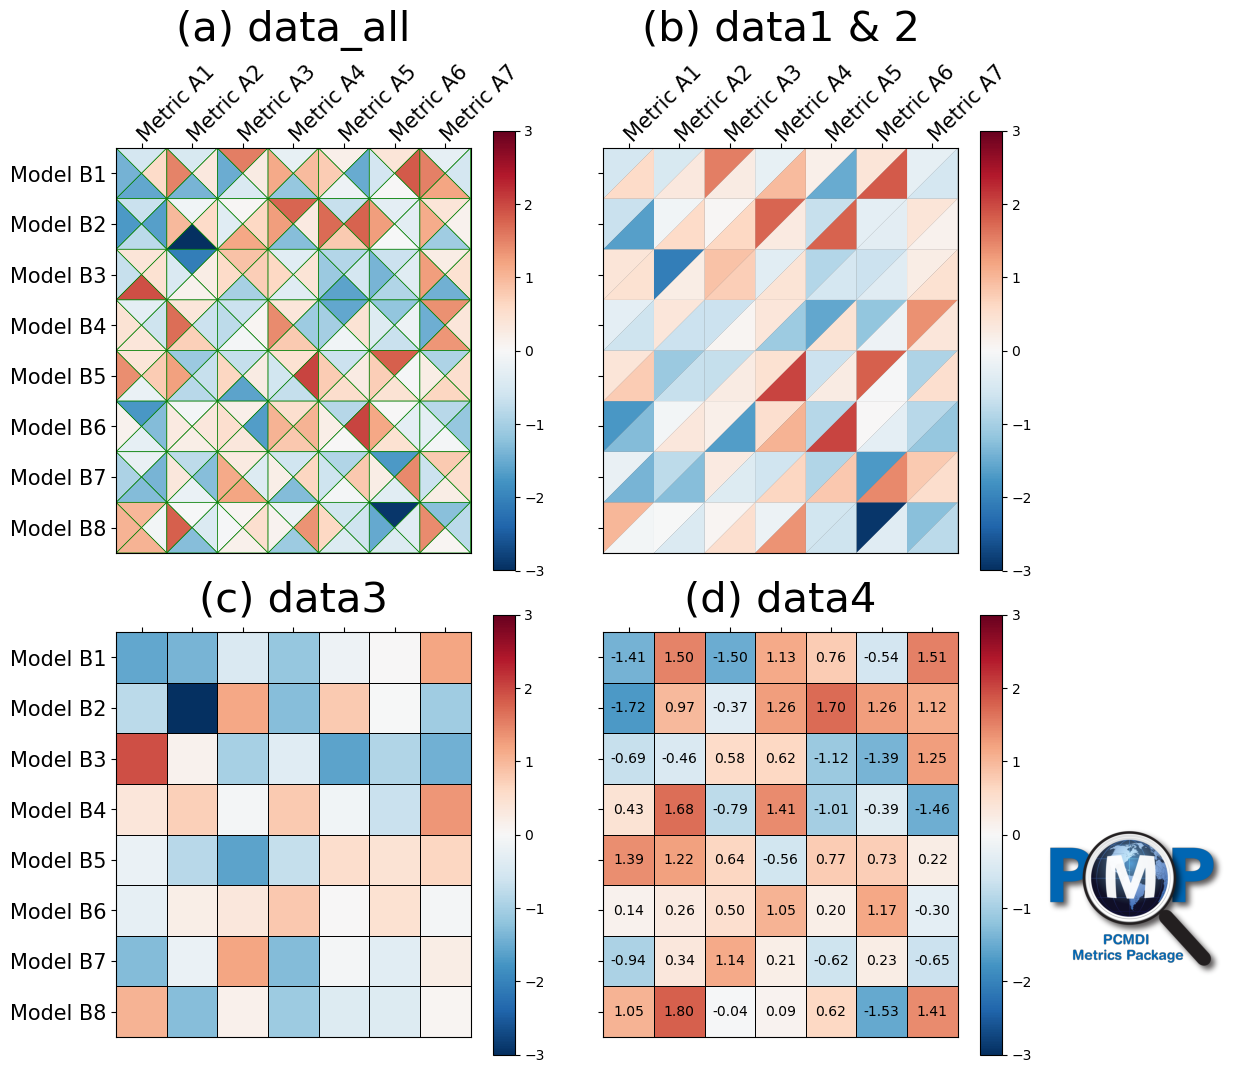
Portrait Plot: Mean Climate

Portrait Plot: Mean Climate, comparing CMIP5 & CMIP6 models
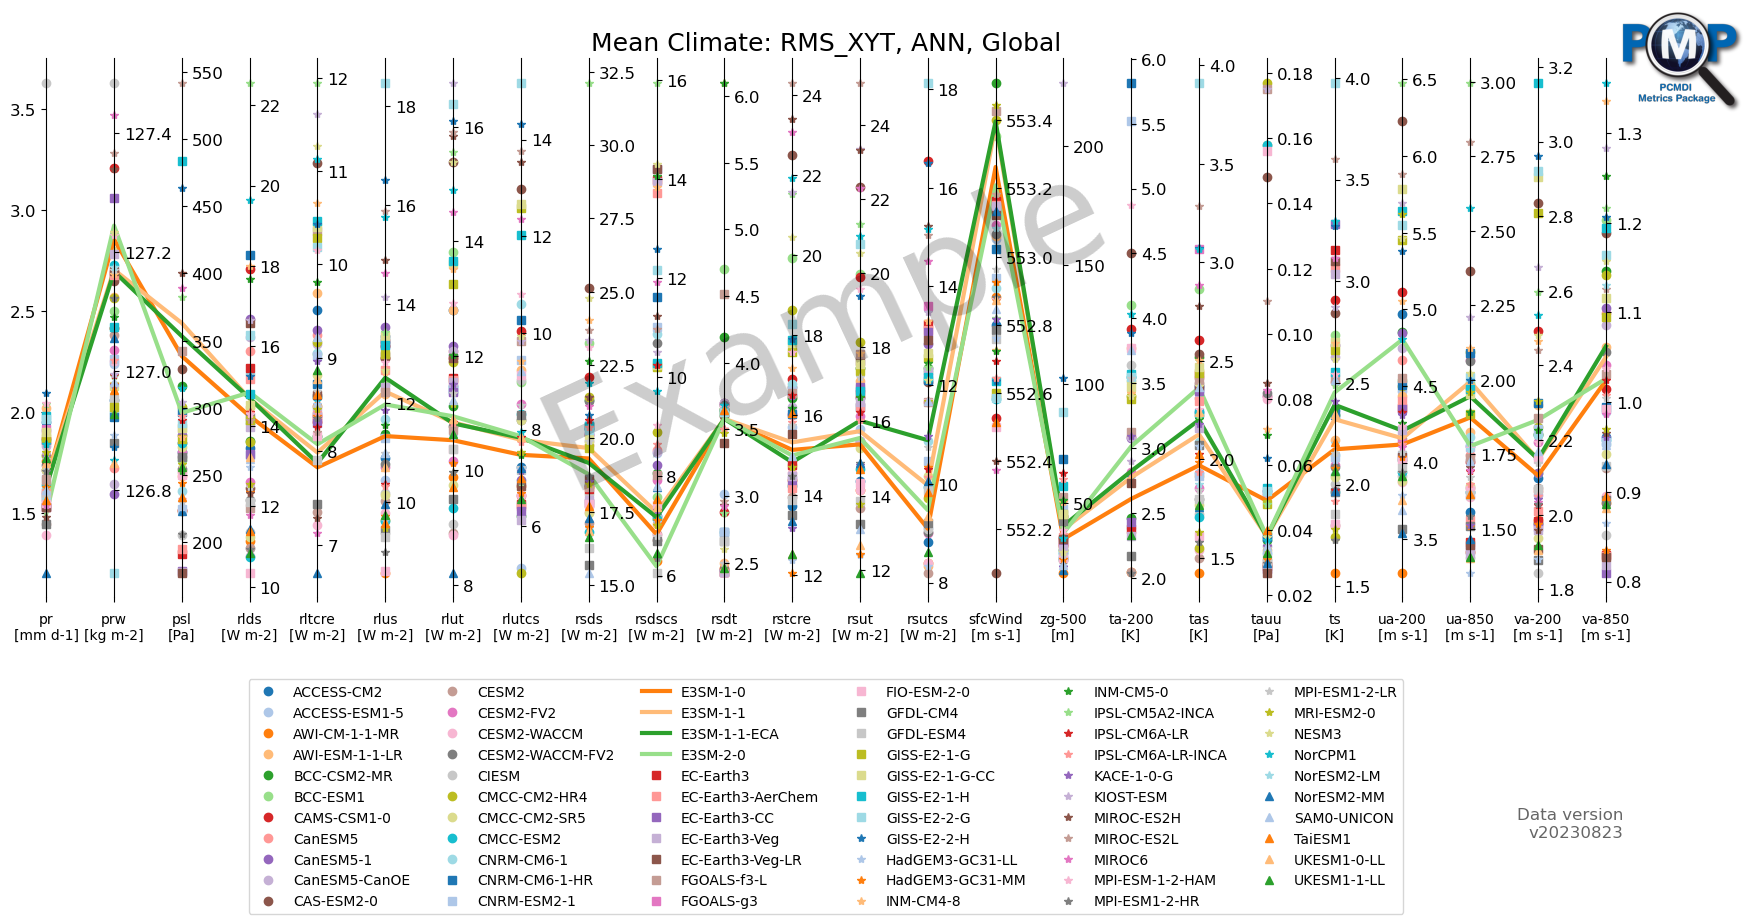
Parallel Coordinate Plot: Mean Climate
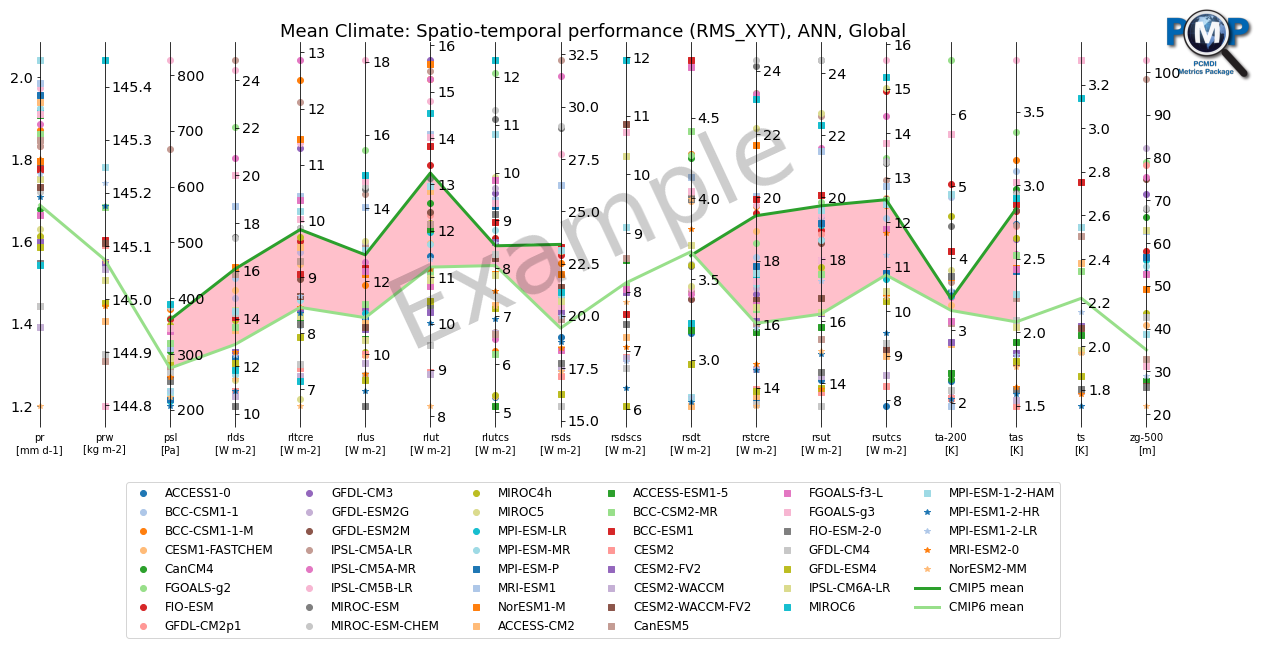
Parallel Coordinate Plot: Mean Climate, comparing CMIP5 & CMIP6 models

Taylor Diagram: Mean Climate, comparing CMIP5 & CMIP6 models

PMP mean climate: Compare user’s model with CMIP6

Portrait Plot: ENSO

Visualize PMP Modes of Variability results: CMIP6
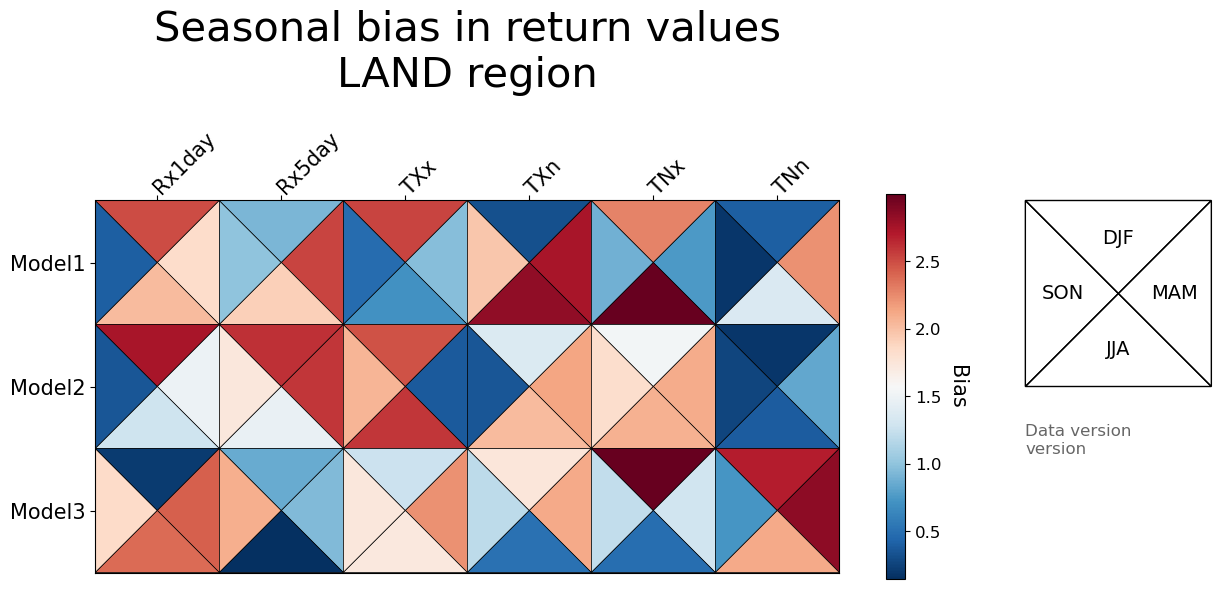
Return Value Portrait Plot Demo
