Portrait Plot: Usage Example
Generate a static image of Portrait plot (with or without triangles) using the PMP function based on Matplotlib.
Author: Jiwoo Lee (2021.07)
Last update: 2024.11
1. Input (Dummy Array)
Input data is expected as a set a (stacked or list of) 2-d numpy array(s) with list of strings for x and y axes labels.
[1]:
import numpy as np

# Test dummy array -- fill random numbers for each array
data1 = np.random.randn(8, 7)
data2 = np.random.randn(8, 7)
data3 = np.random.randn(8, 7)
data4 = np.random.randn(8, 7)

"""
# Test dummy array -- fill same numbers for each array
data1 = np.full((8, 7), -2)
data2 = np.full((8, 7), -1)
data3 = np.full((8, 7), 1)
data4 = np.full((8, 7), 2)
"""

data_all = np.stack([data1, data2, data3, data4])
xaxis_labels = ['A1', 'A2', 'A3', 'A4', 'A5', 'A6', 'A7']
yaxis_labels = ['B1', 'B2', 'B3', 'B4', 'B5', 'B6', 'B7', 'B8']

xaxis_labels = ['Metric '+x for x in xaxis_labels]
yaxis_labels = ['Model '+y for y in yaxis_labels]
2. Matplotlib-based PMP Visualization Function
[2]:
from pcmdi_metrics.graphics import portrait_plot
Parameters
data: 2d numpy array, a list of 2d numpy arrays, or a 3d numpy array (i.e. stacked 2d numpy arrays)xaxis_labels: list of strings, labels for xaixs. Number of list element must consistent to x-axis, or 0 (empty list) to turn off xaxis tick labelsyaxis_labels: list of strings, labels for yaxis. Number of list element must consistent to y-axis, or 0 (empty list) to turn off yaxis tick labelsfig:matplotlib.figureinstance to which the portrait plot is plotted. If not provided, use current axes or create a new one. Optional.ax:matplotlib.axes.Axesinstance to which the portrait plot is plotted. If not provided, use current axes or create a new one. Optional.annotate: bool, default=False, add annotating text if true, but work only for heatmap style map (i.e., no triangles)annotate_data: 2d numpy array, default=None. If None, the image’s data is used. Optional.annotate_textcolors: Tuple. A pair of colors for annotation text. Default is (“black”, “white”)annotate_textcolors_threshold: Tuple or float. Value in data units according to which the colors from textcolors are applied. Default=(-2, 2)annotate_fontsize: number (int/float), default=15. Font size for annotationannotate_format: format for annotate value, default=”{x:.2f}”figsize: tuple of two numbers (width, height), default=(12, 10), figure size in inchesvrange: tuple of two numbers, range of value for colorbar. Optional.xaxis_fontsize: number, default=15, font size for xaxis tick labels. Optional.yaxis_fontsize: number, default=15, font size for yaxis tick labels. Optional.xaxis_tick_labels_top_and_bottom: bool, default=False, if true duplicate xaxis tick label to the other side. Optional.xticklabel_rotation: int or float, default=45, degree of angle to rotate x-axis tick label. Optionalinner_line_color: string, default=”k” (black), color for inner lines (triangle edge lines). Optional.inner_line_width: float, default=0.5, line width for inner lines (triangle edge lines). Optional.cmap: string, default=”RdBu_r”, name of matplotlib colormap. Optional.cmap_bounds: list of numbers. If given, discrete colors are applied. Optional.cbar_label: string, default=None, label for colorbar. Optional.cbar_label_fontsize: number, default=15, font size for colorbar labels. Optional.cbar_tick_fontsize: number, default=12, font size for colorbar tick labels. Optional.cbar_kw: A dictionary with arguments tomatplotlib.Figure.colorbar. Optional.colorbar_off: Trun off colorbar if True. Optional.missing_color: color, default=”grey”,matplotlib.axes.Axes.set_facecolorparameter. Optional.invert_yaxis: bool, default=True, place y=0 at top on the plot. Optional.box_as_square: bool, default=False, make each box as square. Optional.legend_on: bool, default=False, show legend (only for 2 or 4 triangles portrait plot). Optional.legend_labels: list of strings, legend labels for triangls. Optional.legend_box_xy: tuple of numbers, position of legend box’s upper-left corner. Optional. (lower-left ifinvert_yaxis=False), inaxescoordinate. Optional.legend_box_size: number, size of legend box. Optional.legend_lw: number, line width of legend, default=1. Optional.legend_fontsize: number, font size for legend, default=14. Optional.logo_rect: sequence of float. The dimensions [left, bottom, width, height] of the the PMP logo. Optional. All quantities are in fractions of figure width and height. Optionallogo_off: bool, default=False, turn off PMP logo. Optional.debug: bool, default=False, if true print more message when running that help debugging. Optional.
Return
fig: matplotlib component for figureax: matplotlib component for axiscbar: matplotlib component for colorbar (not returned if colorbar_off=True)
3. Usage example
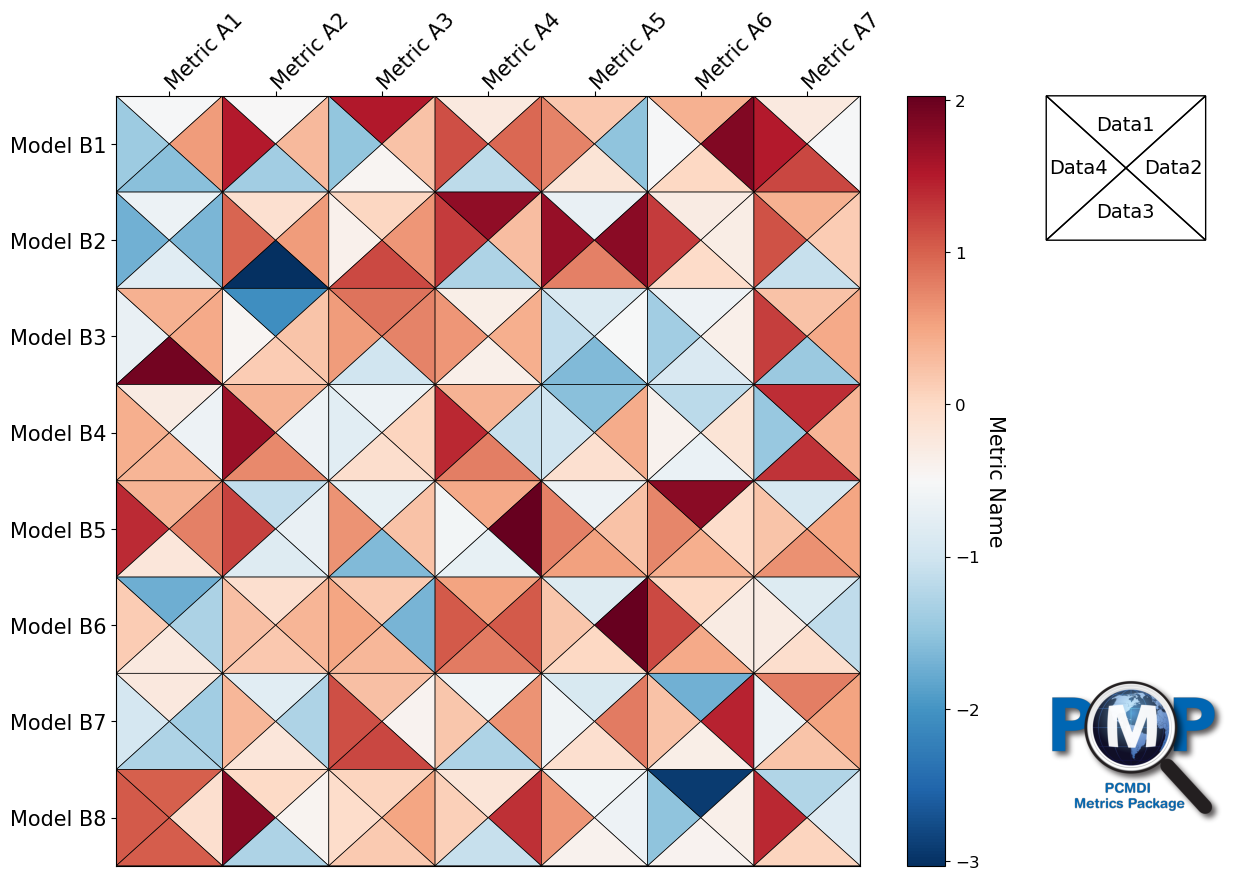
3.1 Portrait Plot with 4 Triangles
data order is clockwise from top: top, right, bottom, left
[3]:
fig, ax, cbar = portrait_plot(data_all,  # or [data1, data2, data3, data4] (top, right, bottom, left: clockwise from top)
                              xaxis_labels=xaxis_labels,
                              yaxis_labels=yaxis_labels,
                              cbar_label='Metric Name',
                              legend_on=True,
                              legend_labels=['Data1', 'Data2', 'Data3', 'Data4']
                             )
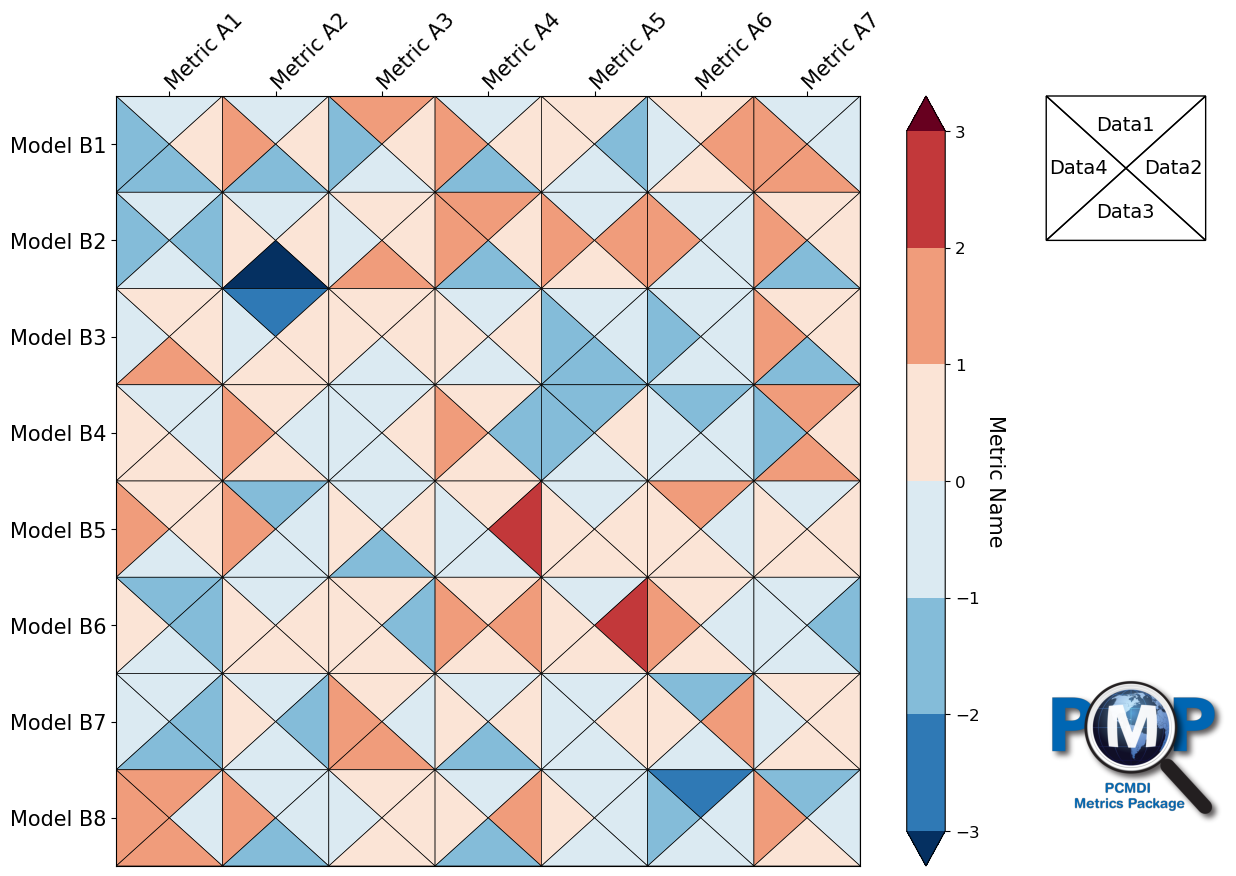
Use discrete color levels
Use
cmap_boundsandcbar_kw={"extend": "both"}
[4]:
fig, ax, cbar = portrait_plot(data_all,  # or [data1, data2, data3, data4] (top, right, bottom, left: clockwise from top)
                              xaxis_labels=xaxis_labels,
                              yaxis_labels=yaxis_labels,
                              cbar_label='Metric Name',
                              legend_on=True,
                              legend_labels=['Data1', 'Data2', 'Data3', 'Data4'],
                              cmap_bounds=[-3, -2, -1, 0, 1, 2, 3],
                              cbar_kw={"extend": "both"}
                             )
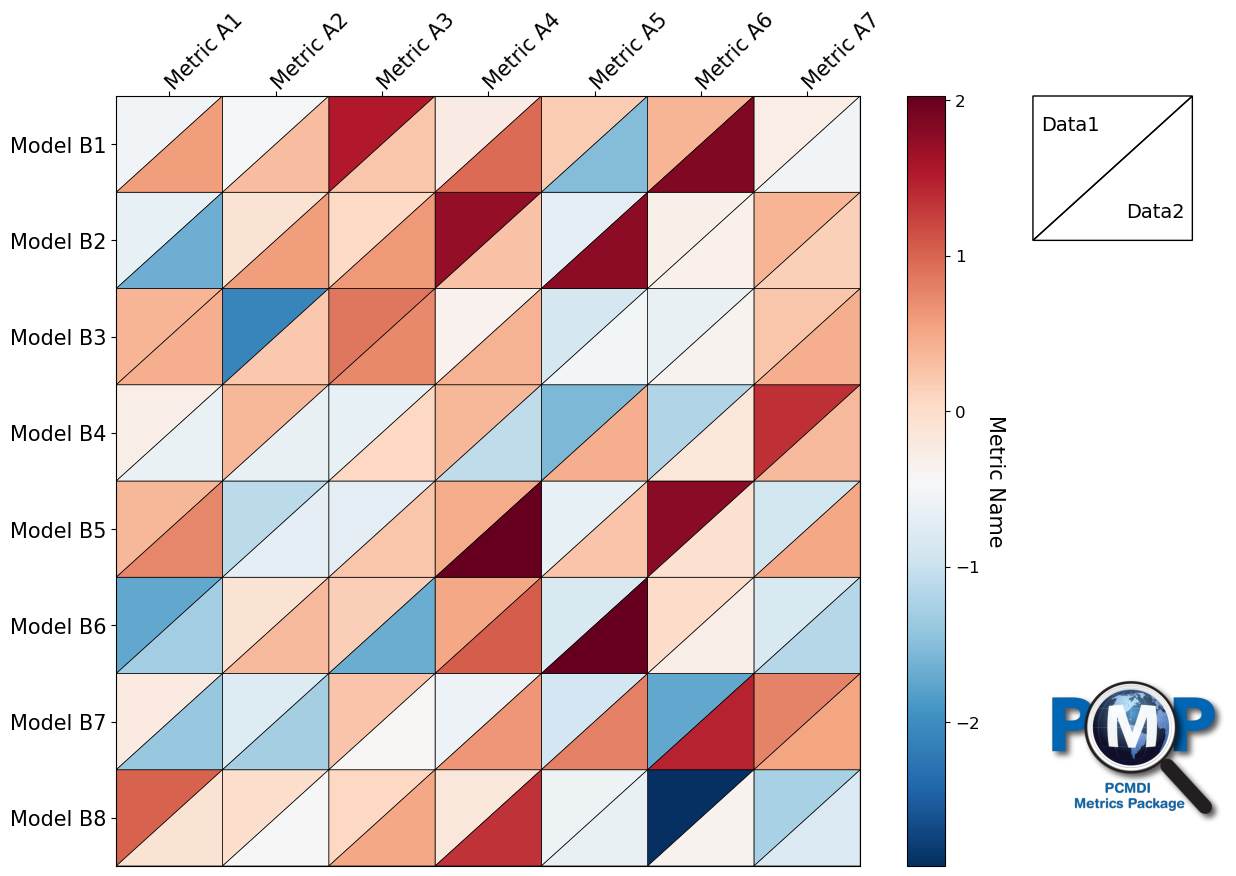
3.2 Portrait Plot with 2 Triangles
[5]:
fig, ax, cbar = portrait_plot([data1, data2],  # or np.stack([data1, data2]) for (upper, lower)
                              xaxis_labels=xaxis_labels,
                              yaxis_labels=yaxis_labels,
                              cbar_label='Metric Name',
                              legend_on=True,
                              legend_labels=['Data1', 'Data2'])
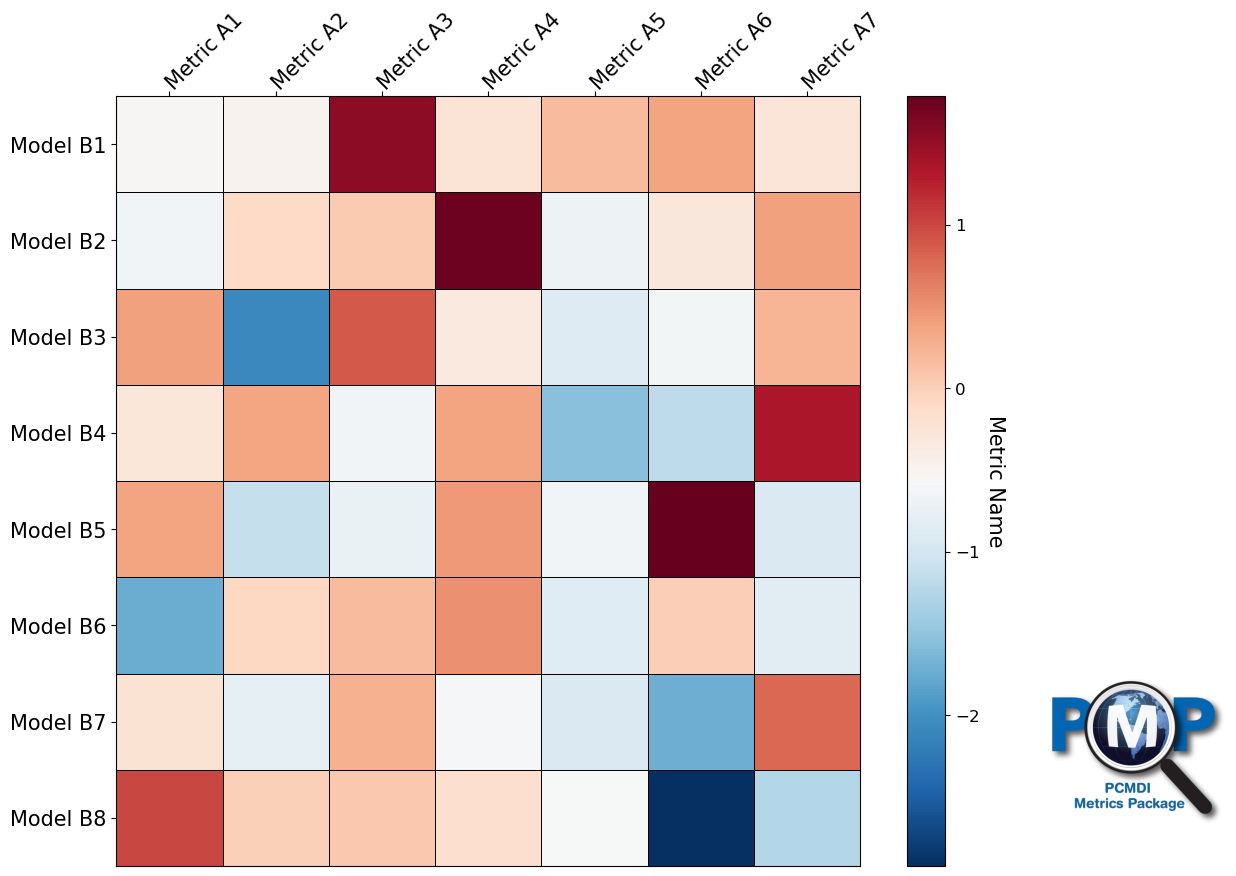
3.3 Portrait Plot without Triangles (Heatmap-style)
[6]:
portrait_plot(data1, # or [data1]
              xaxis_labels=xaxis_labels,
              yaxis_labels=yaxis_labels,
              cbar_label='Metric Name')
[6]:
(<Figure size 1200x1000 with 3 Axes>,
 <Axes: >,
 <matplotlib.colorbar.Colorbar at 0x15fe77bb0>)
3.3.2 Annotated Heatmap
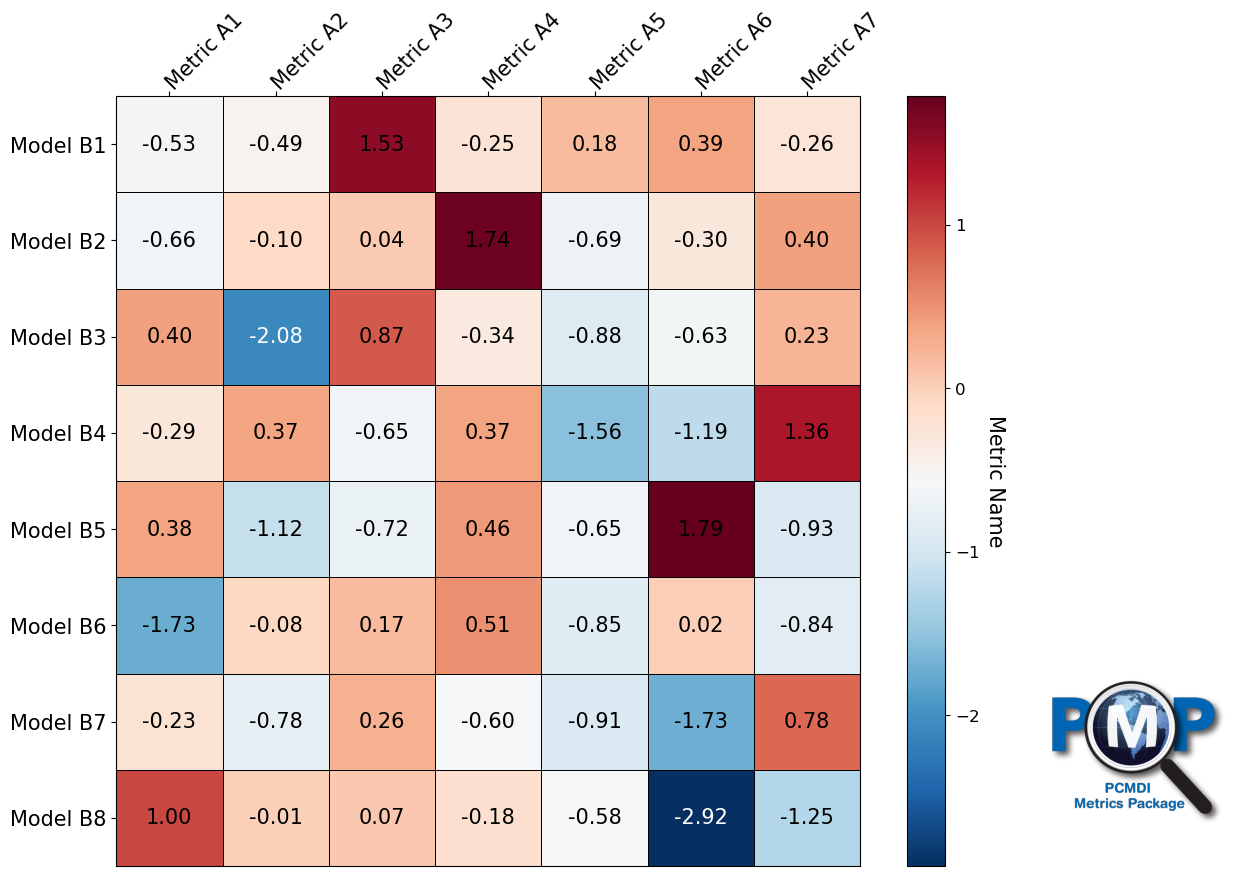
Showing numbers in each box is only avaiable with the heatmap-style (no triangle) portrait plot. By default, in each box value corresponding to color is shown.
[7]:
portrait_plot(data1,
              xaxis_labels=xaxis_labels,
              yaxis_labels=yaxis_labels,
              annotate=True,
              cbar_label='Metric Name')
[7]:
(<Figure size 1200x1000 with 3 Axes>,
 <Axes: >,
 <matplotlib.colorbar.Colorbar at 0x16001b1f0>)
3.3.3 Annotated Heatmap (use alternative numbers)
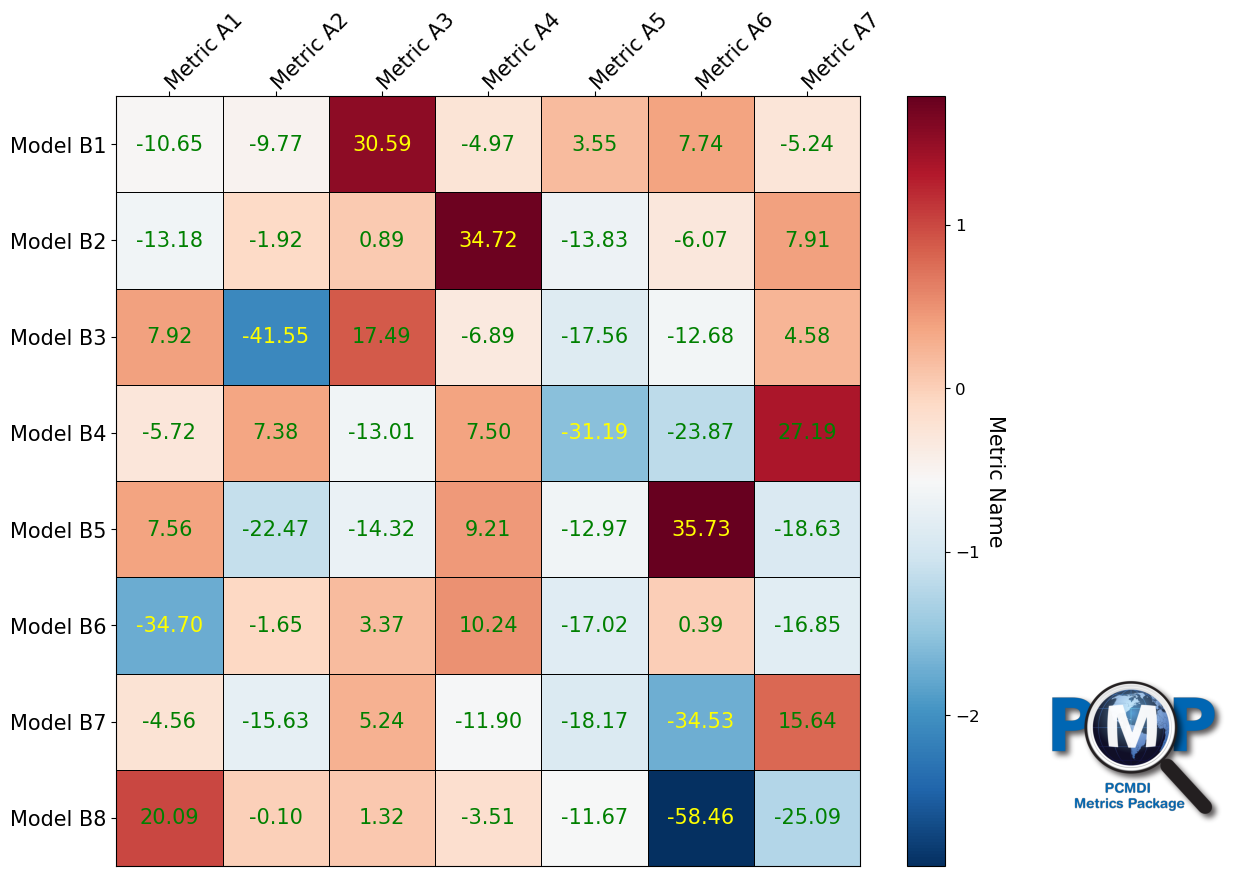
If you want to use different number than colored (e.g., usually portrait plot uses normalized numbers per metric for colors but you want to show actual metric value that is not normalized), you can assign another array as annotate_data. Note that the 2d array given as the annotate_data should have the same size as the given 2d array for plotting.
[8]:
annotate_data = data1 * 20

portrait_plot(data1,
              annotate_data = annotate_data,
              xaxis_labels=xaxis_labels,
              yaxis_labels=yaxis_labels,
              annotate_textcolors=("green", "yellow"),
              annotate_textcolors_threshold=(-1.5, 1.5),
              annotate=True,
              cbar_label='Metric Name')
[8]:
(<Figure size 1200x1000 with 3 Axes>,
 <Axes: >,
 <matplotlib.colorbar.Colorbar at 0x16019a2f0>)
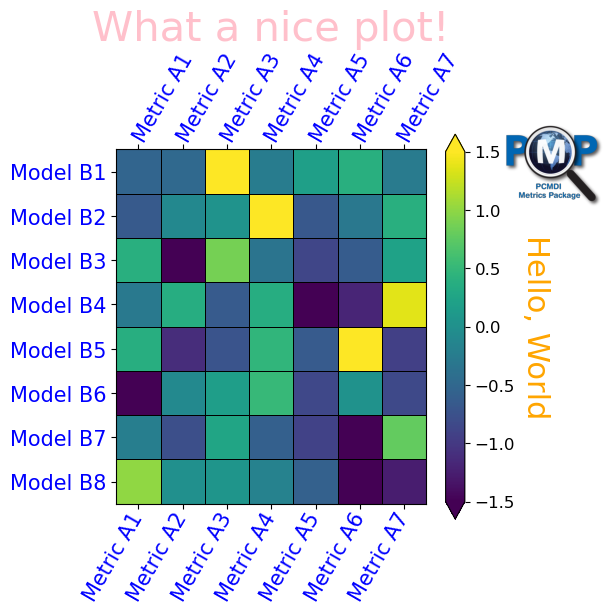
3.3.4 Further customizations
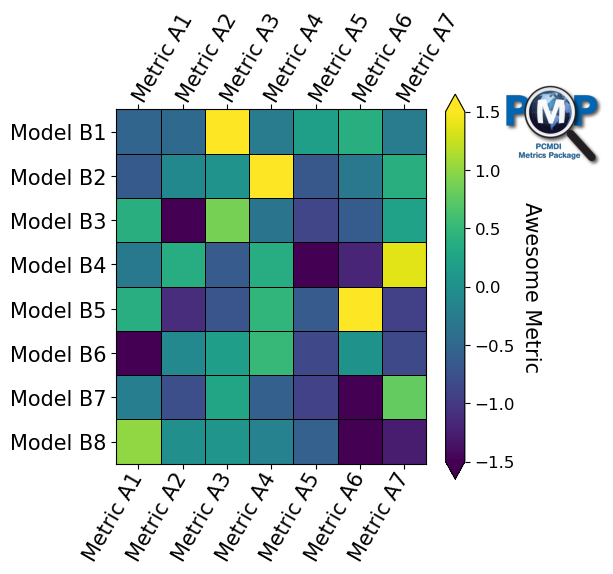
Use input parameters of
portrait_plotfunction for customizing the plot.In addition, by returning
`fig<https://matplotlib.org/stable/api/_as_gen/matplotlib.pyplot.figure.html>`__ (figure),`ax<https://matplotlib.org/stable/api/axes_api.html>`__ (axis), and`cbar<https://matplotlib.org/stable/api/_as_gen/matplotlib.pyplot.colorbar.html>`__ (colorbar), which are`matplotlib<https://matplotlib.org/>`__ components, enables further plot customizations.
[9]:
fig, ax, cbar = portrait_plot(data1,
                              xaxis_labels=xaxis_labels,
                              yaxis_labels=yaxis_labels,
                              xaxis_tick_labels_top_and_bottom=True,
                              xticklabel_rotation=60,
                              cbar_label='Awesome Metric',
                              figsize=(5, 5),
                              vrange=(-1.5, 1.5),
                              cmap="viridis",
                              box_as_square=True,
                              cbar_kw={"extend": "both"},
                              logo_rect = [0.9, 0.7, 0.2, 0.2]
                             )
Further customizations are avaialble by using returned
`fig<https://matplotlib.org/stable/api/_as_gen/matplotlib.pyplot.figure.html>`__ (figure),`ax<https://matplotlib.org/stable/api/axes_api.html>`__ (axis), and`cbar<https://matplotlib.org/stable/api/_as_gen/matplotlib.pyplot.colorbar.html>`__ (colorbar), which are`matplotlib<https://matplotlib.org/>`__ components.
[10]:
ax.set_title('What a nice plot!', fontsize=30, color="pink")
ax.tick_params(labelcolor='blue')
cbar.ax.set_ylabel("Hello, World", rotation=-90, ha="center", fontsize=22, color="orange")
fig
[10]:
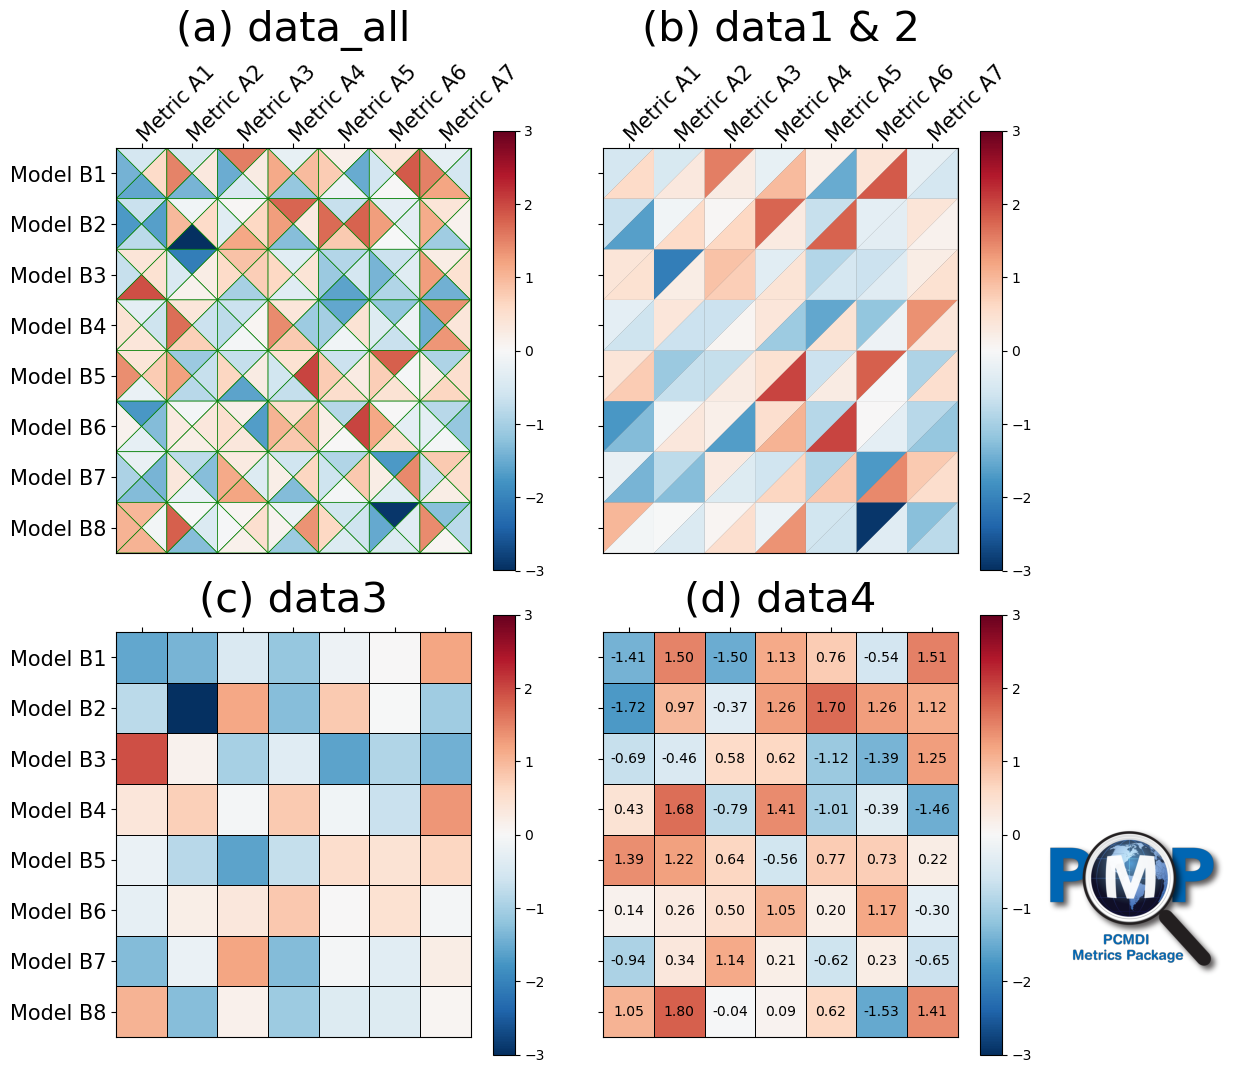
3.3.5 Multi-panel plot
You can make also a multi-panel plot.
[11]:
import matplotlib.pyplot as plt

fig, ax = plt.subplots(nrows=2, ncols=2, figsize=(12,12))

portrait_plot([data1, data2, data3, data4],
              fig=fig, ax=ax[0,0],
              xaxis_labels=xaxis_labels,
              yaxis_labels=yaxis_labels,
              inner_line_color="green",
              vrange=(-3, 3), box_as_square=True, logo_off=True)
ax[0,0].set_title('(a) data_all', fontsize=30, pad=15)

portrait_plot([data1, data2],
              fig=fig, ax=ax[0,1],
              xaxis_labels=xaxis_labels,
              yaxis_labels=[],
              inner_line_width=0,
              vrange=(-3, 3), box_as_square=True, logo_off=True)
ax[0,1].set_title('(b) data1 & 2', fontsize=30, pad=15)

portrait_plot(data3,
              fig=fig, ax=ax[1,0],
              xaxis_labels=[],
              yaxis_labels=yaxis_labels,
              vrange=(-3, 3), box_as_square=True, logo_off=True)
ax[1,0].set_title('(c) data3', fontsize=30, pad=15)

portrait_plot(data4,
              annotate=True,
              annotate_fontsize=10,
              fig=fig, ax=ax[1,1],
              xaxis_labels=[],
              yaxis_labels=[],
              vrange=(-3, 3), box_as_square=True)
ax[1,1].set_title('(d) data4', fontsize=30, pad=15)

plt.subplots_adjust(wspace=0.1, hspace=0.1)

plt.show()
