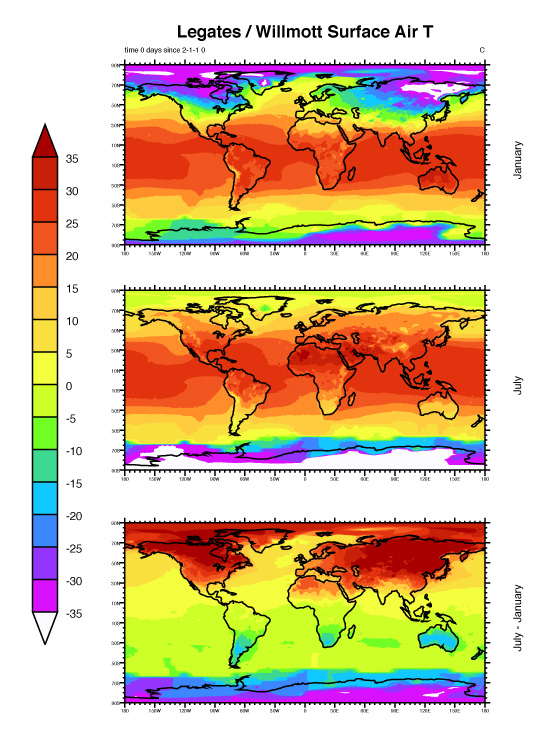
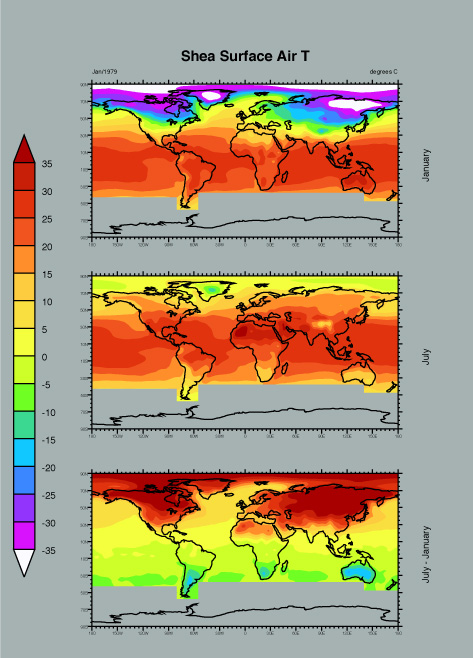
The following links point to graphics displaying climatological mean January, July and (July - January) surface air temperature. This quantity is shown for each of the CMIP1 models and for each of five observed data sets. For a summary and discussion of these results, see the manuscript "The Seasonal Cycle in Coupled Ocean-Atmosphere General Circulation Models" by Covey et al.
FIGURES
| Observed | Individual Models | Zonal Average |
| ECMWF Reanalysis Jones instrumental Legates instrumental NCEP Reanalysis Shea instrumental |
BMRC CCCMA CCSR CERFACS COLA CSIRO ECHAM1+LSG ECHAM3+LSG ECHAM4+OPYC GFDL GISS (Miller) GISS (Russell) LMD+IPSL MRI NCAR CSM NCAR (Washington & Meehl) UKMO |
All models and observations |